Nifty 50
- Trent₹2,867.60287.60 (11.15%)
- Tech Mahindra₹1,500.30-35.60 (-2.32%)
- Kotak Mahindra Bank₹429.8013.80 (3.32%)
- Coal India₹417.05-8.05 (-1.89%)
- Jio Financial ₹218.656.65 (3.14%)
- Max Healthcare₹901.85-15.15 (-1.65%)
- BSE₹3,270.9091.30 (2.87%)
- Apollo Hospitals₹7,874-111.00 (-1.39%)
- HDFC Life Insurance ₹545.3014.30 (2.69%)
- Infosys₹1,009-11.50 (-1.13%)
- Reliance Industries₹1,215.4029.00 (2.44%)
- ONGC₹222.45-2.45 (-1.09%)
- JSW Steel₹1,256.3021.00 (1.70%)
- TCS₹2,095.20-19.20 (-0.91%)
- SBI Life Insurance ₹1,737.4027.90 (1.63%)
- HCL Technologies₹1,192-9.90 (-0.82%)
- Hindustan Unilever₹1,868.1029.70 (1.62%)
- Bajaj Finance₹962.70-7.30 (-0.75%)
- Eternal₹325.304.50 (1.40%)
- Grasim Industries₹2,949.90-22.10 (-0.74%)

- Offerings
- Tools & Platforms
Tools & Calculators
- Open API
- Calculators
- SIP Calculator
- CAGR Calculator
- Compound Interest Calculator
- FD Calculator
- RD Calculator
- EPF Calculator
- Retirement Calculator
- HDFC SIP Calculator
- Mutual Fund Return Calculator
- Lumpsum Calculator
- Step Up SIP Calculator
- ETF SIP Calculator
- Brokerage Calculator
- Equity Margin Calculator
- SWP Calculator
- EMI Calculator
- MTF Calculator
- Margin Pledge Calculator
- Algo Strategy
- Markets
Stocks
F&O
Mutual Funds
- More
Markets Demonstrate Resilience During Geopolitical Events
By HDFC SKY | Updated at: Apr 8, 2026 08:03 PM IST
Open Free Demat Account
Open Free Demat Account
Historical Patterns Point to Recovery After Corrections
Mumbai, April 8: Indian equity markets have continued to display resilience in the face of geopolitical disruptions, with historical trends indicating consistent recovery following periods of sharp correction.
Corrections Typically Followed by Recovery Phases
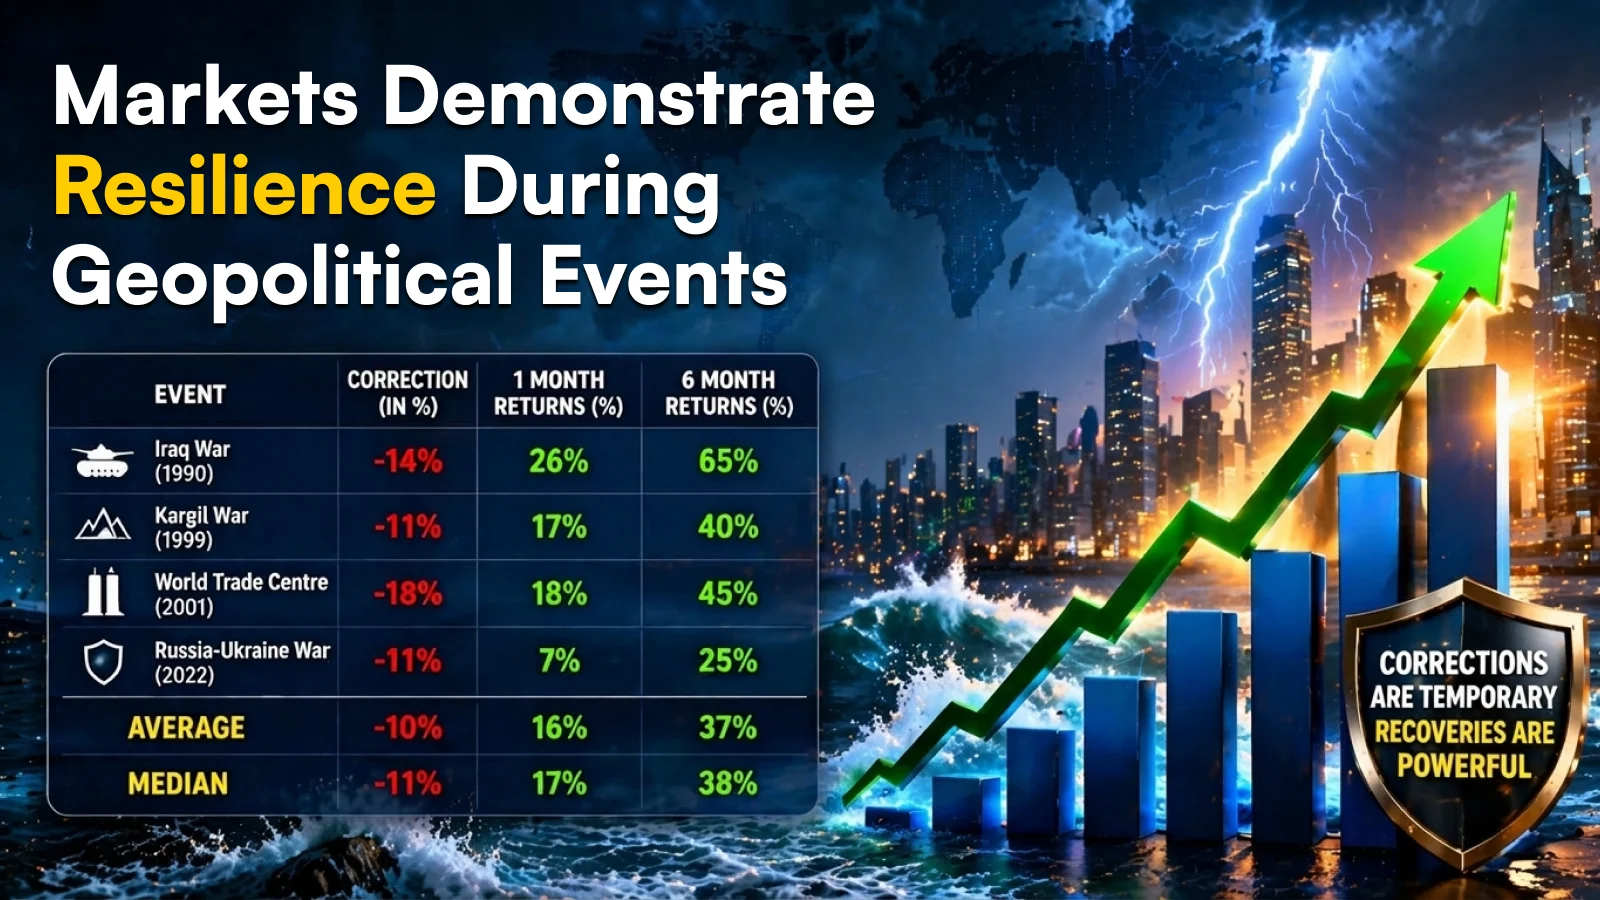
Historical instances underline this pattern. During the Iraq War in 1990, markets declined by 14 per cent but rebounded with returns of 26 per cent within one month and 65 per cent over six months.
Similarly, the Kargil War in 1999 saw an 11 per cent correction, followed by gains of 17 per cent in one month and 40 per cent over six months. After the World Trade Centre incident in 2001, markets fell 18 per cent but recovered 45 per cent over a six-month period.
More recent developments mirror this trend. The Russia-Ukraine conflict in 2022 resulted in an 11 per cent correction, followed by a 7 per cent recovery in one month and 25 per cent over six months.
On average, corrections have been around 10 per cent, with subsequent returns of 16 per cent after one month and 37 per cent over six months. Median figures stand at an 11 per cent correction, followed by 17 per cent and 38 per cent recovery over one and six months respectively.



Open Free Demat Account
Open Free Demat Account
Popular Posts
- 10 Interesting Facts About NSE You Probably Didn’t KnowLast Updated: Sep 30, 2026
- 8-4-3 Rule of SIP - How Does That Work?Last Updated: Jul 30, 2025
- Let's view more exciting Post!
Popular Post from Media Coverage
- India’s young investors are changing the markets : The industry must change tooLast Updated: Sep 17, 2026
- HDFC SKY Sees Sharp Generational and Digital Shift in New-Age IPO InvestingLast Updated: Sep 17, 2026
- HDFC SKY Launches Scalper Terminal for Faster, Smarter Options Trading; InvestRight Gets the Same Edge, Powered by NXTOptionLast Updated: Sep 3, 2026
- The Modern Muhurat: Why Investors are Swapping the Jewellery Store for the Demat Account?Last Updated: Apr 15, 2026
- Akshaya Tritiya 2026: Why Do We Invest in Gold on This Day?Last Updated: Apr 15, 2026
- Let's view more exciting Post!
Popular Post from Blogs
- “Bounce Back” Theme Gains Traction in 2026Last Updated: Apr 8, 2026
- 5 Takeaways for Tax Payers from the Budget 2025Last Updated: Jan 29, 2026
- Let’s view more exciting Posts


Invest Anytime, Anywhere


By signing up I certify terms, conditions & privacy policy