Nifty 50
- Bharat Electronics₹392.8512.75 (3.35%)
- TCS₹2,427-72.10 (-2.89%)
- Adani Enterprises₹2,678.6085.30 (3.29%)
- Infosys₹1,118-30.10 (-2.62%)
- Max Healthcare₹91620.50 (2.29%)
- Coal India₹399.20-8.80 (-2.16%)
- ITC₹280.156.25 (2.28%)
- HCL Technologies₹1,408.30-30.80 (-2.14%)
- Titan Company₹4,650.4088.40 (1.94%)
- BSE₹3,602-63.70 (-1.74%)
- Adani Ports₹1,90336.10 (1.93%)
- Eternal₹343.85-5.60 (-1.60%)
- Bajaj Finserv₹1,747.9029.80 (1.73%)
- Kotak Mahindra Bank₹457.60-7.05 (-1.52%)
- Bajaj Finance₹985.5515.55 (1.60%)
- Tech Mahindra₹1,767.10-22.00 (-1.23%)
- InterGlobe Aviation₹5,085.2060.20 (1.20%)
- Nestle₹1,233.40-15.00 (-1.20%)
- Sun Pharmaceutical₹1,789.1019.20 (1.08%)
- NTPC₹318.40-3.15 (-0.98%)

- Offerings
- Tools & Platforms
Tools & Calculators
- Open API
- Calculators
- SIP Calculator
- CAGR Calculator
- Compound Interest Calculator
- FD Calculator
- RD Calculator
- EPF Calculator
- Retirement Calculator
- HDFC SIP Calculator
- Mutual Fund Return Calculator
- Lumpsum Calculator
- Step Up SIP Calculator
- ETF SIP Calculator
- Brokerage Calculator
- Equity Margin Calculator
- SWP Calculator
- EMI Calculator
- MTF Calculator
- Margin Pledge Calculator
- Algo Strategy
- Markets
Stocks
F&O
Mutual Funds
- More
Share Market Today
Nifty 50
04 Nov
23823.85
383.05 (1.63%)
BSE Sensex
04 Nov
76963.96
1271.18 (1.68%)
Bank Nifty
04 Nov
55610.80
608.60 (1.11%)
Nifty 500
04 Nov
22626.40
385.00 (1.73%)
Open Free Demat Account
Open Free Demat Account
Stock Market News
Business News
International News
IPO News
Stock Market News
Media Coverage

Dalmia Bharat Sugar Q2 Profit Nearly Triples to Rs 68 Crore on Strong Sales
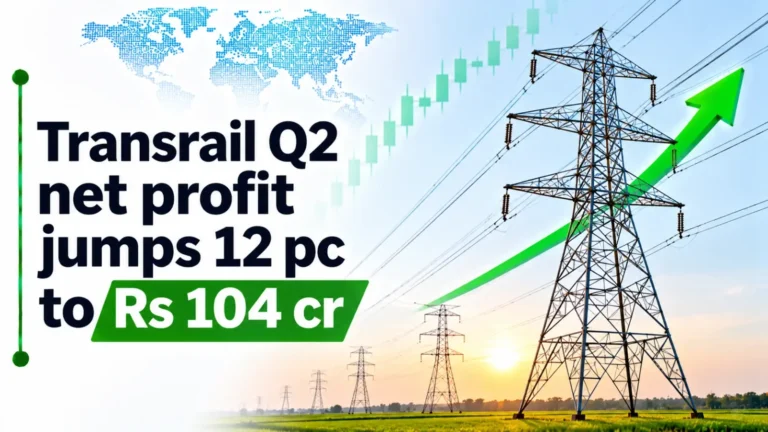
Transrail Q2 Net Profit Jumps 12% to Rs 104 Cr

Allcargo Logistics Posts Rs 19 Crore Profit in Q2FY27; Revenue Rises 3.4%

IndiQube Spaces Posts Rs 6 Cr Loss in September Quarter, Revenue Rises to Rs 492 Cr


Market Statistics
Explore all Stocks, Indian and Global Indices , Volume Shockers, Top Gainers, Top Losers just in few clicks.
Company Name | ₹Price | ₹Change | %Change |
|---|---|---|---|
| Marvel Decor Ltd. | 63.95 | 10.00 | 18.54 |
| HMA Agro Industries Ltd. | 29.37 | 4.28 | 17.06 |
| Faze Three Ltd. | 535 | 83.50 | 18.49 |
| Anya Polytech & Fertilizers Ltd. | 18.5 | 0.15 | 0.82 |
| Fractal Analytics Ltd. | 826.2 | 93.40 | 12.75 |
Company Name | ₹Price | 52W High | %Change |
|---|---|---|---|
| Emcure Pharmaceuticals Ltd. | 2168.9 | 2100.7 | 9.73 |
| GNG Electronics Ltd. | 750.1 | 740.4 | 9.15 |
| Technocraft Ventures Ltd. | 548.95 | 517 | 8.31 |
| VRL Logistics Ltd. | 314.4 | 319.2 | 6.41 |
| Corona Remedies Ltd. | 2393.7 | 2294 | 5.38 |
Index | Value | Change | %Change |
|---|---|---|---|
| Nifty 50 | 23823.85 | 383.05 | 1.63 |
| Bank Nifty | 55610.80 | 608.60 | 1.11 |
| Nifty Financial Services | 25431.60 | 532.55 | 2.14 |
| Nifty Midcap Select | 13640.75 | 274.05 | 2.05 |
| Nifty Total Market | 12773.10 | 218.35 | 1.74 |
Company Name | ₹Price | % Change | Volume |
|---|---|---|---|
| Neuland Laboratories Ltd. | 19650 | 1.16 | 91.87 K |
| Linde India Ltd. | 6286 | 7.48 | 1.39 L |
| Cera Sanitaryware Ltd. | 4668.5 | 0.12 | 39.82 K |
| Thangamayil Jewellery Ltd. | 4621.9 | 1.96 | 62.40 K |
| TCPL Packaging Ltd. | 4481.3 | 7.00 | 19.76 K |
Sectoral Performance of Indices & Stocks

What Is the Share Market?
The share market is a marketplace where shares of publicly listed companies are bought and sold through recognised stock exchanges. A share represents a unit of ownership in a company. Share prices fluctuate based on several factors, including company performance, market demand, economic conditions, corporate announcements and broader market sentiment.
The Indian share market comprises various indices, listed securities and market segments that reflect different aspects of market activity. Understanding these components provides context for interpreting market movements and financial information.
HDFC Sky’s Share Market Today section displays key Indian market benchmarks, including the Nifty 50, BSE Sensex, Bank Nifty and Nifty 500. These indices represent different groups of companies and provide an overview of market performance across selected segments.
The Search for Stocks feature allows users to look up listed companies and access relevant stock-related information. It provides a way to navigate available market data, including details about individual securities and their price movements.
HDFC Sky also provides an Open Free Demat Account option. A Demat account holds eligible securities in electronic form, while a trading account facilitates the buying and selling of securities through the applicable market infrastructure. Account-opening terms, eligibility requirements and applicable charges are subject to the relevant conditions and disclosures.
Types of Share Markets
The share market is broadly divided into two segments: the primary market and the secondary market.
Primary Market
The primary market is where companies issue securities to raise capital. An Initial Public Offering (IPO) is one of the most recognised examples. Through an IPO, a company offers shares to eligible investors under specified issue terms, including the announced price or price band, where applicable.
HDFC Sky’s Upcoming IPOs section provides information about forthcoming public issues and related updates. The information associated with an IPO may include its opening and closing dates, issue details and other relevant particulars, depending on the available platform features.
IPO-related information can vary by issue, and the final terms are set out in the applicable offer documents and official disclosures. An IPO does not guarantee share allotment or any particular listing price.
Secondary Market
The secondary market is where securities that have already been listed on a stock exchange are bought and sold. Their prices change in response to demand and supply, company-specific developments, economic conditions, corporate announcements and market sentiment.
HDFC Sky’s market-statistics features present different aspects of stock-price performance.
(a) Top Gainers and Top Losers
The Top Gainers and Top Losers sections display stocks according to their price performance during the relevant period. These lists provide a snapshot of relative price movements and may change as market prices fluctuate.
The displayed rankings describe historical or current-session performance, depending on the selected data. They do not establish the reasons behind a price movement or indicate how a stock may perform subsequently.
(b) 52-Week Highs and Lows
The 52-Week High and 52-Week Low sections present information about securities in relation to their highest and lowest recorded prices over a 52-week period.
These figures provide historical price context. They do not, by themselves, explain a company’s financial position, valuation or future price behaviour.
(c) Volume Shockers and Value Shockers
HDFC Sky’s Volume Shockers and Value Shockers sections highlight securities with notable trading activity based on the platform’s applicable criteria.
Trading volume refers to the number of shares traded during a specified period.
Traded value refers to the monetary value of transactions during that period.
Changes in volume or traded value may coincide with corporate announcements, earnings releases, changes in market sentiment or other developments. The figures describe trading activity and do not independently establish the reason for a movement.
(d) Explore All Stocks
The Explore All Stocks view provides another way to browse available stock-market information. Depending on the displayed fields, users can examine stock names, prices, percentage changes and other relevant market details.
The available View More controls allow users to navigate additional entries where supported. This feature provides access to a broader selection of stock-related information within the platform.
(e) Sectoral Performance of Indices and Stocks
The Sectoral Performance of Indices & Stocks section presents information about sectoral indices and stocks across different periods.
The Sectoral Indices and Sectors views offer different ways of examining sector-related market data. Available time filters may include daily, weekly, monthly, quarterly, half-yearly, one-year, three-year, five-year and ten-year periods, depending on the platform’s current functionality.
Comparing different time periods can show how reported performance varies across short- and long-term intervals. For example, a sector’s performance over one week may differ from its performance over one year. These comparisons describe past or current data for the specified periods and do not predict future results.
What Are NSE and BSE?
The National Stock Exchange (NSE) and the Bombay Stock Exchange (BSE) are two of India’s principal stock exchanges. They provide regulated marketplaces for trading eligible listed securities under applicable exchange rules and regulatory requirements.
Several widely followed Indian indices represent different segments of the equity market.
- Nifty 50: The Nifty 50 tracks 50 major companies listed on the NSE and serves as a widely followed indicator of the Indian equity market.
- BSE Sensex: The Sensex tracks 30 prominent companies listed on the BSE and reflects the performance of its constituent companies.
- Bank Nifty: This index represents a group of banking stocks and provides information about the performance of the banking segment covered by the index.
- Nifty 500: This index covers a broader group of companies listed on the NSE and represents a wider segment of the Indian equity market.
- HDFC Sky’s Indian Indices and Global Indices sections allow users to explore market benchmarks across domestic and international markets. NSE and BSE selectors in relevant market-statistics views provide access to information associated with the selected exchange.
- Global indices reflect market movements in other countries and regions. Their movements can provide context for understanding international market conditions, although Indian market performance also depends on domestic economic indicators, company results, currency movements, interest rates and other factors.
Understanding Share Market Features
The share market has several defining characteristics, including company ownership through shares, price fluctuations, dividend distributions where declared, and varying levels of market risk.
Ownership in Companies
A share represents an ownership interest in a company. Shareholders may have certain rights associated with their holdings, depending on the type of security and applicable rules. Companies may declare dividends, but distributions are not guaranteed and depend on relevant corporate decisions and requirements.
Price Movements
Listed share prices fluctuate throughout trading sessions in response to buying and selling activity, company announcements, financial results and broader market developments. Price movements may differ across companies, sectors and market indices.
Market Information and Transparency
Stock exchanges and listed companies publish market information and disclosures under applicable requirements. These may include price data, trading volumes, corporate announcements, financial results and other company-related information.
Trading and Liquidity
Listed securities are traded under applicable exchange rules and market timings. The ease with which a security can be bought or sold depends on factors such as market liquidity, trading activity and prevailing prices. Trading availability does not guarantee that a transaction will take place at a particular price.
HDFC Sky brings together several categories of market information, allowing users to view indices, stock statistics, sectoral performance and market-related news through the relevant platform sections.
Investment Products and Market Instruments: An Overview
Financial markets include various securities and instruments with different features, trading arrangements and risks.
- Equities: Shares represent ownership in a company. Their prices fluctuate with company performance, market demand and economic conditions. Dividends may be declared by the company.
- Exchange-Traded Funds (ETFs): ETFs trade on stock exchanges and typically track an index, a basket of securities or another underlying asset.
- Initial Public Offerings (IPOs): An IPO is when a company offers shares to the public for the first time. Issue details, pricing, allotment and listing outcomes vary.
- Futures and Options (F&O): These derivative contracts derive their value from an underlying asset or index. They involve features such as expiry dates, margins and potential financial losses.
- Commodities: Commodity-market instruments are linked to commodity prices, which can fluctuate due to supply and demand, weather, currency movements and geopolitical developments.
- Margin Trading Facility (MTF): MTF allows eligible securities to be purchased using partial funding from the investor and financing through an approved arrangement. Interest, margin requirements and other conditions apply, and losses can be magnified.
- HDFC Sky’s Live Calls section displays categories such as Stocks or Equity, Futures & Options, ETFs, Commodities and MTF. The availability of these categories and their associated terms depend on the platform’s current offerings and applicable conditions.
FAQs on Share Market
What are stocks or shares?
How doe͏s the sha͏r͏e m͏arket ͏wor͏k?
W͏hy should I inve͏st ͏in th͏e share market?
Where can I see share market prices?
How do I start investing in the share market?
What are the investment options for beginners in the stock market?
Where can I get stock market updates?
Invest Anytime, Anywhere


By signing up I certify terms, conditions & privacy policy