Nifty 50
- JSW Steel₹1,241.3025.00 (2.06%)
- Axis Bank₹1,236-54.00 (-4.19%)
- ONGC₹2253.00 (1.35%)
- Tata Motors PV₹278-8.85 (-3.09%)
- SBI₹973.7011.10 (1.15%)
- Infosys₹1,130.70-30.50 (-2.63%)
- L&T₹3,661.9034.80 (0.96%)
- Bajaj Finance₹957.35-24.75 (-2.52%)
- Eicher Motors₹7,34964.50 (0.89%)
- Apollo Hospitals₹7,700-190.00 (-2.41%)
- Adani Ports₹1,76615.20 (0.87%)
- UltraTech Cement₹10,650-257.00 (-2.36%)
- Dr. Reddy's Labs₹1,242.509.50 (0.77%)
- HDFC Bank₹712-16.85 (-2.31%)
- InterGlobe Aviation₹4,70013.10 (0.28%)
- Trent₹2,891.60-67.10 (-2.27%)
- Bharat Electronics₹377.200.35 (0.09%)
- Hindustan Unilever₹1,853.20-40.60 (-2.14%)
- NTPC₹309-6.15 (-1.95%)

- Offerings
- Tools & Platforms
Tools & Calculators
- Open API
- Calculators
- SIP Calculator
- CAGR Calculator
- Compound Interest Calculator
- FD Calculator
- RD Calculator
- EPF Calculator
- Retirement Calculator
- HDFC SIP Calculator
- Mutual Fund Return Calculator
- Lumpsum Calculator
- Step Up SIP Calculator
- ETF SIP Calculator
- Brokerage Calculator
- Equity Margin Calculator
- SWP Calculator
- EMI Calculator
- MTF Calculator
- Margin Pledge Calculator
- Algo Strategy
- Markets
Stocks
F&O
Mutual Funds
- More
Deep Dive – The 1-year Return Trap
Authored By HDFC SKY | Last Modified: Oct 6, 2025 09:14 AM IST
Open Free Demat Account
Open Free Demat Account
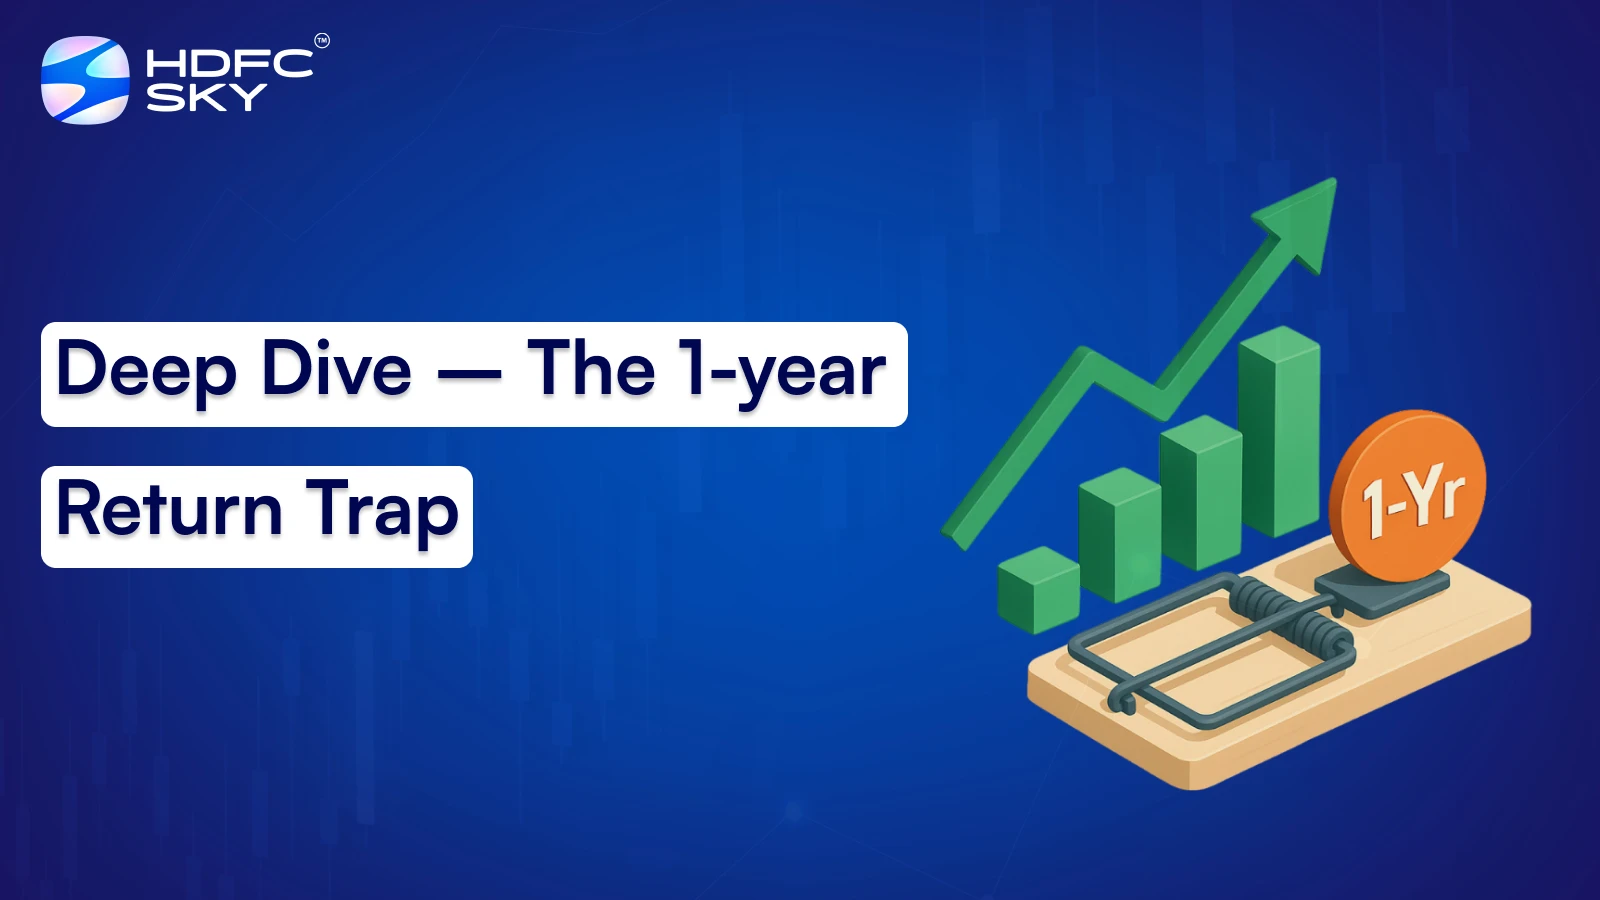
Stop focusing on short-term wins! An analysis done by HDFC Tru, spanning mutual fund data from 2005 to 2025, shows that a fund’s recent stellar performance especially its 1-year return is often a misleading boost that inflates its overall record and doesn’t reliably predict future success. The main lesson is to resist the urge to “chase” the current top-ranked funds; true investing strength comes from consistency over the long haul, not from a single, spectacular sprint.
The 1 Year Return Trap
Imagine you’re an investor, and an equity asset manager approaches you, showcasing a set of brilliant returns. They’re in the middle of a “purple patch”, a period of excellent, recent outperformance—and they’re eager to show off. They present periodic returns (1-year, 3-year, 5-year) stacked against the market benchmark and their competitors. You look at the numbers, and they all look impressive. This happens because the manager’s incredible recent outperformance (the 1-yr return) simply folds into and inflates the 2-yr, 3-yr, and 5-yr performance as well. Also, often the time proven schemes go through temporary rough patch. In such situations, the fund manager could be under pressure to change selection thesis.
In this study, we evaluated the efficacy of looking at only the recent outperformance. One year return folds into other period returns. As indicated above, the funds who hit a purple patch (recent outperformance – 1 year return in this case) approach investors and showcase them periodic returns as against the benchmark / peer group. Our study clearly demonstrates that recent outperformance (1 year in this case) folds into 2 yr, 3 yr, 4 yr, 5yr returns as well and thereby tends to inflate them.
Main conclusions
- Recent outperformance folds into periodic returns (2yr, 3 yr, 5yr).
- Higher periodic returns do not imply consistency in fund’s performance.
- Selecting funds on basis of recent outperformance does not ensure future outperformance.
To see full report and study : https://hdfc-tru.com/wp-content/uploads/2025/09/Deep-Dive-The-1-Year-Trap-1.pdf
Source : HDFC-Tru email :tru@hdfcsec.com Ph: 919930203944
Disclaimer : This content is only for informational purpose. It does not make any recommendation to act or invest.
 Join Us
 Add as preferred source on Google


More Markets News








Open Free Demat Account
Open Free Demat Account












Invest Anytime, Anywhere


By signing up I certify terms, conditions & privacy policy