Nifty 50
- Infosys₹1,16534.30 (3.03%)
- Eternal₹308.80-11.40 (-3.56%)
- Tech Mahindra₹1,82747.90 (2.69%)
- Bajaj Finance₹924.20-33.15 (-3.46%)
- TCS₹2,52261.10 (2.48%)
- Eicher Motors₹7,130-219.00 (-2.98%)
- HCL Technologies₹1,406.4026.50 (1.92%)
- Trent₹2,810-81.60 (-2.82%)
- UltraTech Cement₹10,814164.00 (1.54%)
- Bajaj Auto₹10,012-275.00 (-2.67%)
- SBI Life Insurance ₹1,655.107.30 (0.44%)
- Maruti Suzuki₹11,177-298.00 (-2.60%)
- Reliance Industries₹1,206.504.50 (0.37%)
- Bharat Electronics₹367.85-9.35 (-2.48%)
- Tata Consumer ₹9703.50 (0.36%)
- BSE₹3,258-78.00 (-2.34%)
- ICICI Bank₹1,385.904.90 (0.35%)
- Adani Enterprises₹2,597-60.50 (-2.28%)
- ONGC₹225.320.32 (0.14%)
- Nestle₹1,216-26.70 (-2.15%)

- Offerings
- Tools & Platforms
Tools & Calculators
- Open API
- Calculators
- SIP Calculator
- CAGR Calculator
- Compound Interest Calculator
- FD Calculator
- RD Calculator
- EPF Calculator
- Retirement Calculator
- HDFC SIP Calculator
- Mutual Fund Return Calculator
- Lumpsum Calculator
- Step Up SIP Calculator
- ETF SIP Calculator
- Brokerage Calculator
- Equity Margin Calculator
- SWP Calculator
- EMI Calculator
- MTF Calculator
- Margin Pledge Calculator
- Algo Strategy
- Markets
Stocks
F&O
Mutual Funds
- More
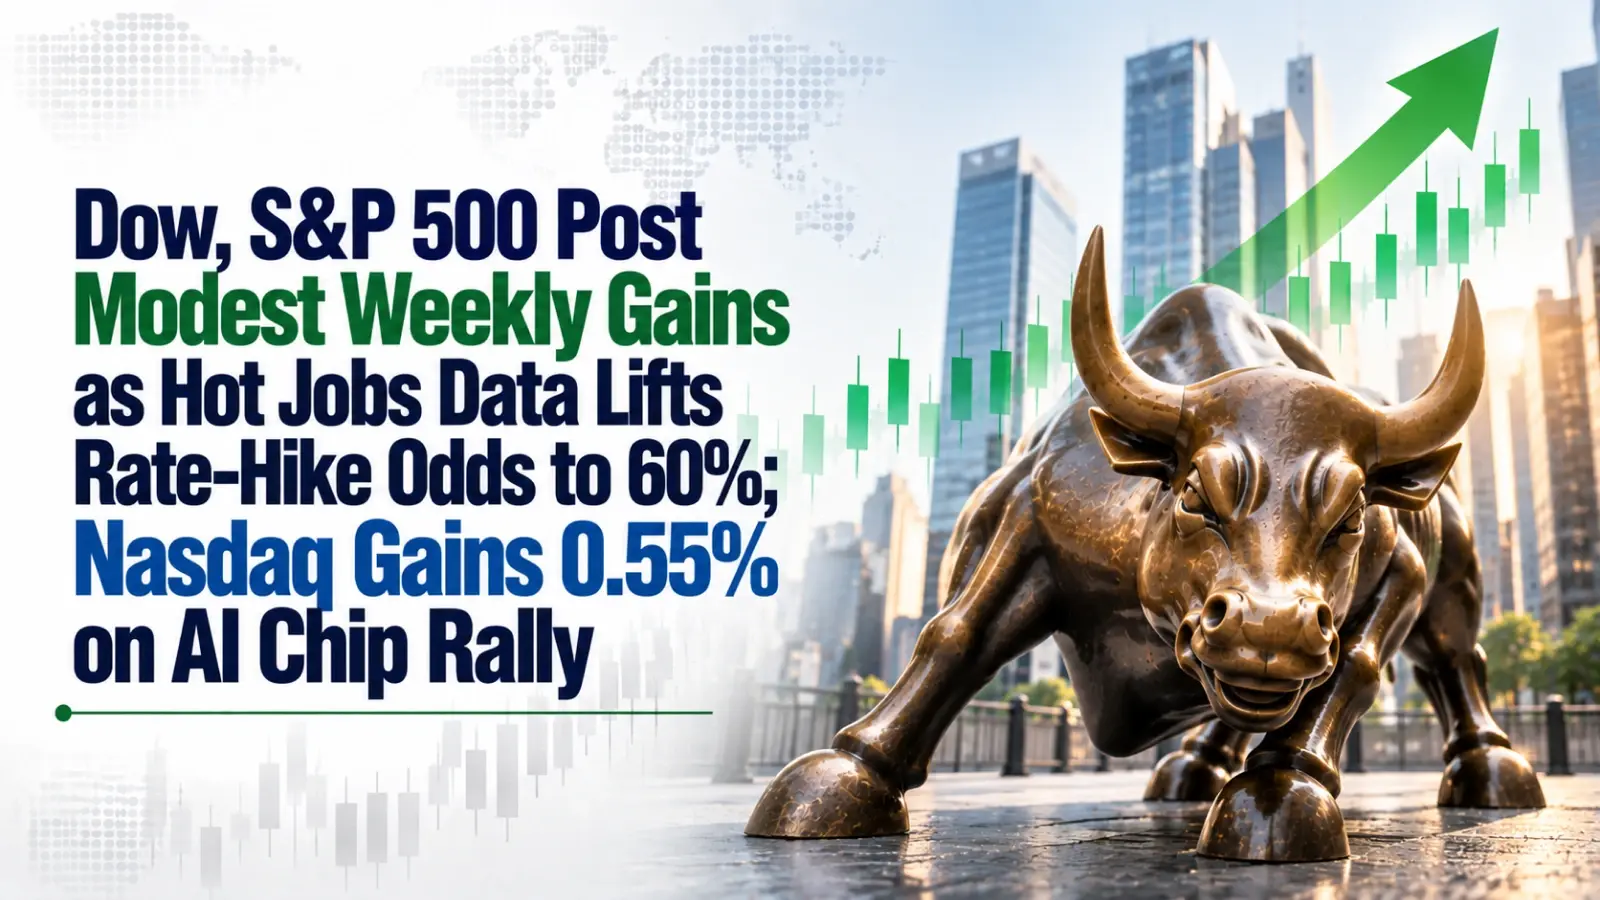
Dow, S&P 500 Post Modest Weekly Gains as Hot Jobs Data Lifts Rate-Hike Odds to 60%; Nasdaq Gains 0.55% on AI Chip Rally
Authored By HDFC SKY | Last Modified: Sep 8, 2026 12:17 PM IST
Open Free Demat Account
Open Free Demat Account
Mumbai, Sept 5: A week of sharp reversals and sectoral rotations drew to a close on Friday, with the Dow Jones Industrial Average and the S&P 500 posting modest weekly gains while the tech-heavy Nasdaq Composite advanced on the back of a powerful late-week rally in semiconductor and artificial intelligence stocks. Escalating US-Iran military tensions, which pushed Brent crude above $95 per barrel, combined with a hotter-than-expected August jobs report that lifted September rate-hike probabilities to 60%, kept investors on edge throughout the holiday-shortened week. The 10-year Treasury yield touched an intraday high of 4.818%—its highest level since November 2023—before retreating to 4.78%, while the CBOE Volatility Index (VIX) remained subdued, reflecting a market that, despite geopolitical shocks, has yet to enter panic territory.
Dow Jones Industrial Average Gains 0.24% as 23 Components Advance on Thursday Rally
The Dow Jones Industrial Average (^DJI) closed the week at 53,414.25, gaining 124.26 points or 0.24% from the previous Friday’s close of 53,289.99. The index opened the week at 53,462.60 on Monday, 31 August, and traded within a weekly range of 53,123.62 to 53,746.50.
Monday’s session saw the index tumble 374.09 points, or 0.70%, to 53,185.90 as renewed US-Iran military strikes pushed crude oil above $90 per barrel. The blue-chip index recovered modestly on Tuesday, adding 293.74 points or 0.56% to 53,061.95, before staging its strongest session of the week on Thursday, surging 624.16 points or 1.18% to 53,686.11 after Federal Reserve Governor Christopher Waller signalled support for holding rates unchanged in September. Friday’s jobs report, which showed 162,000 jobs added in August, triggered renewed selling, with the Dow falling 271.86 points or 0.51% to close the week at 53,414.25.
Also Read: What Is the New York Stock Exchange (NYSE)?
Twenty-three of the 30 Dow components ended Thursday in positive territory. Chevron (CVX) was the top performer among Dow components, surging on the back of rising crude prices, while Goldman Sachs (GS) and JPMorgan Chase (JPM) also posted gains. On the losing side, Apple (AAPL) weighed on the index, falling 2.53% on Friday following Tim Cook’s retirement as CEO. Microsoft (MSFT) and Amazon (AMZN) also contributed to the downside.
S&P 500 Rises 0.47% as Energy and Health Care Lead Weekly Gains
The S&P 500 (^GSPC) closed the week at 7,718.60, gaining 36.84 points or 0.47% from the prior Friday’s close of 7,681.76. The index opened the week at 7,697.52 on Monday and traded within a weekly range of 7,611.20 to 7,750.19.
The S&P 500’s resilience despite the week’s headwinds was notable. Thursday’s session saw the index gain 1.1% to finish at 7,747.71, with nine out of 11 sectors ending in positive territory. Nine of the 11 primary S&P 500 sectors closed higher on Thursday, with Materials leading the charge with a 1.7% gain, followed by Communication Services at 1.4%. However, the week’s overall performance was supported by the Energy sector, which gained 3.27% as oil prices surged on geopolitical tensions, and Health Care, which rose 1.22%.
Consumer Discretionary was the weakest sector for the week, dragged down by Lululemon’s 17.5% crash following its earnings miss. Industrials and Materials also underperformed, declining 1.51% and 1.16% respectively. Financials and Information Technology posted modest gains, supported by easing rate-hike fears mid-week.
Nasdaq Composite Adds 0.55% as AI and Semiconductor Stocks Power Late-Week Rally
The Nasdaq Composite (^IXIC) closed the week at 26,506.99, up 136.10 points or 0.55% from the prior Friday’s close of 26,370.89. The index opened the week at 26,358.56 on Monday and traded within a weekly range of 25,995.53 to 26,644.57.
The tech-heavy index’s weekly gain was driven by a powerful late-week rally in semiconductor and AI-related stocks. Thursday’s session saw the Nasdaq surge 1.4% or 366.23 points to 26,584.06, led by Nvidia (NVDA), which rose 1.80%, and Tesla (TSLA), which surged 5.42%. The Nasdaq-100 added 0.17% for the week.
Nvidia was the standout performer among mega-cap tech stocks, rising on the back of its $12.93 billion acquisition of Hugging Face. Tesla also posted strong gains, though the stock fell 6% on Friday after the NHTSA launched an investigation into its newly launched Cybercab. Meta Platforms (META) and Microsoft (MSFT) also contributed to the Nasdaq’s weekly gains. The iShares Semiconductor ETF (SOXX) and the Roundhill Memory ETF (DRAM) both posted strong gains on Friday, reflecting continued demand for AI-related chip stocks.
Russell 2000 Declines 0.14% as Small Caps Underperform Large-Cap Peers
The Russell 2000 Index (^RUT) closed the week at 2,975.92, down 4.25 points or 0.14% from the prior Friday’s close of 2,980.17. The index opened the week at 2,967.43 and traded within a weekly range of 2,916.84 to 2,976.50.
Small-cap stocks underperformed their large-cap peers during the week, reflecting the narrow leadership in the market. The Russell 2000 declined 1.37% on Friday alone, as small caps could not escape the headwind from rising Treasury yields. The index’s weakness was attributed to higher borrowing costs and geopolitical uncertainty, which weighed more heavily on smaller companies with greater debt sensitivity.
Also Read: What Is the S&P 500? A Simple Guide for Everyday Investors
Within the Russell 2000, top performers included Bloom Energy (BE), which surged 7.39%, and SMTC Corporation, which gained 9.22%. On the losing side, Victoria’s Secret (VSXY) was the worst performer, plunging following its earnings report. The index’s 52-week range stands at 2,303.46 to 3,069.71.
S&P 100 Gains on Blue Chip Strength as Mega-Cap Tech Stocks Outperform
The S&P 100 Index (OEX) closed the week at 3,825.25, gaining from the prior Friday’s close. The index opened the week at 3,805.34 and traded within a weekly range of 3,789.00 to 3,852.23.
The S&P 100’s weekly gain was driven by strength in mega-cap technology and financial stocks. Goldman Sachs (GS) was a top performer, rising on the back of easing rate-hike fears. Nvidia (NVDA) and Meta Platforms (META) also contributed to the index’s advance. The index’s performance reflected the broader market’s rotation into large-cap names, with investors seeking safety in the most liquid and established companies amid geopolitical uncertainty.
Dow Jones Transportation Sheds on Oil Fears; Utility Average Gains as Yields Retreat
The Dow Jones Transportation Average (DJT) closed the week at 21,011.73, down from the prior Friday’s close. The weakness in transportation stocks was driven by concerns over higher fuel costs and potential supply chain disruptions amid escalating US-Iran tensions.
The Dow Jones Utility Average (DJU) closed the week at 1,082.78, gaining from the prior Friday’s close. Utilities, often seen as bond proxies, rallied as the 10-year Treasury yield pulled back from its recent highs.
The Dow Jones Composite Average (DJC) closed the week at 16,774.77. The mixed performance across the three averages highlighted the divergent impact of current market conditions on different sectors of the economy.
Philadelphia Semiconductor Index Surges as Memory and AI Names Lead Friday Charge
The PHLX Semiconductor Sector Index (SOX) closed the week at 11,735.26, gaining 200.21 points or 1.74% from the prior Friday’s close of 11,535.05. The index opened the week at 11,529.16 on Monday and traded within a weekly range of 11,056.38 to 11,750.26.
The semiconductor sector’s outperformance was driven by strong AI-related demand and positive earnings from key chipmakers. Friday’s session saw the SOX surge 383.13 points or 3.37% to close at 11,735.26, as memory and AI names led the charge. SanDisk (SNDK) jumped 10.3%, KLA Corp (KLAC) rose 8.2%, and Super Micro Computer (SMCI) gained 7.3%.
The sector’s weekly gain was supported by Nvidia’s 1.8% advance and Micron Technology’s (MU) strong performance. However, Broadcom (AVGO) was a notable laggard, tumbling 6% after its fourth-quarter revenue guidance disappointed Wall Street. The SOX’s 52-week range stands at 5,503.1 to 14,655.3.
NYSE Composite Advances on Broad-Based Participation
The NYSE Composite Index (NYA) closed the week at 24,633.59. The index opened the week at 24,585.18 and traded within a weekly range of 24,449.46 to 24,720.15.
The NYSE Composite’s weekly gain reflected broad-based participation across sectors, with advancing stocks outnumbering decliners on the New York Stock Exchange by a margin of nearly 2-to-1 on Thursday. The index’s performance was supported by strength in financials, industrials, and materials names. The NYSE Composite’s 52-week range stands at 20,894.59 to 24,866.75.
S&P MidCap 400 and SmallCap 600 Show Mixed Performance as Smaller Stocks Lag
The S&P 400 MidCap Index (SP400) closed the week at 3,785.24, gaining 24.97 points or 0.66% from the prior Friday’s close. The index opened the week at 3,779.47 and traded within a weekly range of 3,743.32 to 3,794.66.
Also Read: What Is the New York Stock Exchange (NYSE)?
The S&P 600 SmallCap Index (SP600) closed the week at 1,765.09, declining from the prior Friday’s close. Mid-cap stocks outperformed small caps during the week, reflecting the narrow leadership in the market. Despite the short-term weakness, small-cap stocks remain the best-performing major market segment year-to-date, with the S&P SmallCap 600 up 20.8% compared to the S&P 500’s 13.1% gain.
Both mid-cap and small-cap indices faced headwinds from rising Treasury yields and geopolitical uncertainty, which weighed more heavily on smaller companies with greater debt sensitivity.
CBOE Volatility Index Retreats as Market Remains Calm Despite Geopolitical Shocks
Sector Performance: Energy and Health Care Lead as Consumer Discretionary Lags
Among the 11 primary S&P 500 sectors, Energy was the best-performing sector for the week, gaining 3.27% as crude oil prices surged on US-Iran tensions. WTI crude rose over 8% and Brent crude gained more than 7% over the week, as the conflict revived concerns over potential supply disruptions tied to the Strait of Hormuz.
Health Care followed with a 1.22% gain, supported by defensive rotations and positive trial data from Novartis. Information Technology rose 0.86%, driven by AI-linked large-cap strength. Consumer Discretionary was the weakest sector, declining 0.87%, dragged down by Lululemon’s 17.5% crash following its earnings miss. Industrials fell 1.51% and Materials declined 1.16%.
Year-to-date, Energy leads S&P 500 sector gains with +43.5%, followed by Technology at +23.3% and Materials at +15.3%. Health Care is the weakest performer year-to-date with just +2.2%.
Biggest Weekly Gainers and Losers: Snowflake and Dell Surge, Lululemon and Campbell’s Plunge
Snowflake (SNOW) was the standout performer, surgeing 16.6% after the cloud data platform posted upbeat second-quarter financial results. The company reported adjusted earnings of $0.62 per share on revenue of $1.55 billion, exceeding analyst expectations. Hewlett Packard Enterprise (HPE) jumped 5% after reporting record quarterly revenue of $12.21 billion and adjusted earnings of $1.11 per share, beating estimates.
Nvidia (NVDA) rose approximately 0.21% over the week, supported by its $12.93 billion acquisition of Hugging Face. Tesla (TSLA) surged 6.08% for the week, though the stock gave back some gains on Friday. Palantir Technologies (PLTR) and Oracle (ORCL) also posted strong gains, rising on Thursday’s rally.
Also Read: How to invest in US stocks
Lululemon Athletica (LULU) was the worst performer, plunging 17.5% after the athleisure retailer slashed its full-year outlook and reported its first comparable sales drop since the pandemic. Victoria’s Secret (VSXY) plummeted 11.82% after reporting second-quarter net sales that fell short of consensus estimates.
Broadcom (AVGO) tumbled nearly 6% after its fourth-quarter revenue forecast came in at $34.8 billion against the $35.05 billion estimate. Edison International (EIX) and PG&E Corp (PCG) were among the worst performers on the S&P 500 on Monday, falling 27% and 26.7% respectively.
Magnificent Seven Performance: Mixed Results as AI-Led Rally Favours Select Names
The Roundhill Magnificent Seven ETF (MAGS) **surged nearly 2.5% on Thursday to $70.43**, approaching its record closing high of $70.94 set in May. The ETF holds equal weight in the seven mega-cap technology stocks.
Nvidia (NVDA) and Apple (AAPL) were the closest to their all-time highs, both within 3% of their record levels. Tesla (TSLA) surged 5.51% on Monday and posted a weekly gain of 6.08%. Meta Platforms (META) gained 0.99% on Friday, while Alphabet (GOOGL) added 1.59%. Amazon (AMZN) rose 1.54%, and Microsoft (MSFT) declined 2.04% on Friday.
Semiconductor, Financial, Energy and AI Stocks Show Varied Performance
Semiconductor stocks were the standout performers, with the SOX gaining 1.74% for the week. SanDisk (SNDK) jumped 10.3%, KLA Corp (KLAC) rose 8.2%, and Super Micro Computer (SMCI) gained 7.3% on Friday. The sector was driven by strong AI-related demand and positive earnings from key chipmakers. However, Broadcom (AVGO) was a notable laggard, tumbling after its revenue guidance disappointed.
Financial stocks performed strongly, benefiting from the decline in Treasury yields and easing rate-hike fears mid-week. The sector advanced 1.55% on Thursday, with major banks and financial institutions seeing broad-based gains.
Energy stocks outperformed the broader market, gaining 3.27% for the week as oil prices surged on US-Iran tensions. Chevron and Exxon Mobil were among the top performers in the sector.
AI and growth stocks continued to attract investor interest, with Nvidia, Snowflake, and Palantir posting strong gains. The narrow leadership in AI-linked names helped the headline indexes, but semiconductors, software, cyclicals, and smaller companies traded unevenly.
Economic Data: Jobs Report and Jobless Claims Shape Rate Expectations
The Bureau of Labor Statistics reported that US employers added 162,000 jobs in August, far exceeding the roughly 55,000 economists had expected. The July figure was revised sharply higher to a gain of 21,000 from an initially reported decline of 23,000. The unemployment rate held steady at 4.1%. Average hourly earnings rose 0.3% month-on-month, while year-on-year wage growth slowed to 3.1% from 3.2% previously.
ISM Manufacturing slowed to 54.6 in August from 55.6 in July, which is still expansionary but showing some loss of momentum. ISM Services improved to 55.4, with new orders at 60.9, but the price index component climbed to 72.6, and employment remained contractionary at 47.8.
Also Read: US Stock Market Timings
Initial jobless claims for the week ending 29 August totalled 206,000, slightly above the 205,000 consensus estimate. Continuing claims rose by 8,000 to 1.779 million. JOLTS showed job openings were little changed at roughly 7.3 million in July, while hires and separations were also little changed.
Federal Reserve and Bond Market: Rate-Hike Odds Swing from 35% to 60%
Federal Reserve Chairman Kevin Warsh’s hawkish comments at the Jackson Hole symposium on 28 August set the tone for the week. Warsh warned that inflation remained “too hot” and that the central bank still had work to do. The probability of a 25-basis-point rate hike at the September meeting surged from approximately 35-40% before Warsh’s speech to nearly 57% within a single day.
Federal Reserve Governor Christopher Waller provided a counterweight on Thursday, stating that he would support holding rates unchanged in September if inflation data continues to show improvement. Waller’s remarks moderated rate-hike expectations to approximately 50%.
However, Friday’s hot jobs report pushed rate-hike probabilities back to roughly 60%. The policy-sensitive 2-year Treasury yield surged to 4.39% following the report, hitting its highest level since January 2025. The benchmark 10-year Treasury yield hit 4.818% intraday on Wednesday, its highest level since November 2023, before retreating to approximately 4.78% by Friday’s close. The 30-year Treasury yield formed at 5.246%.
Also Read: What Are Fractional Shares?
The yield curve remained inverted, with the 2-year yield trading below the 10-year yield. The spread between the 10-year and 2-year narrowed to 39.4 basis points.
The week’s price action underscored the market’s sensitivity to geopolitical shocks and Federal Reserve policy signals, with the Dow and S&P 500 posting modest weekly gains while the Nasdaq advanced on AI-driven semiconductor strength. The hot August jobs report reset rate-hike probabilities to 60%, pushing the two-year Treasury yield to 4.39% and the 10-year to 4.78%. Semiconductor and AI stocks continued to outperform amid strong earnings from Nvidia, Dell, and Snowflake, while consumer discretionary and software names faced significant selling pressure. Next week’s CPI and PPI reports will be critical in determining whether the Fed proceeds with a rate hike at its September 15-16 meeting.
Disclaimer: At HDFC SKY, we take utmost care and due diligence in curating and presenting news and market-related content. However, inadvertent errors or omissions may occasionally occur.
If you have any concerns, questions, or wish to point out any discrepancies in our content, please feel free to write to us at content@hdfcsec.com.
Please note that the information shared is intended solely for informational purposes and does not make any investment recommendations
Source
- spglobal.com/spdji/en/indices/equity/sp-500/
References
Disclaimer
At HDFC SKY*, we take utmost care and due diligence in curating and presenting news and market-related content. However, inadvertent errors or omissions may occasionally occur.
If you have any concerns, questions, or wish to point out any discrepancies in our content, please feel free to write to us at content@hdfcsec.com.
Please Note: The information shared is intended solely for informational purposes and does not make any investment recommendations.
HDFC SKY from HDFC Securities, one of most trusted trading platforms in India, has been recognized with the *Next-Gen Digi Content Awards 2025-26.
 Join Us
 Add as preferred source on Google


More Business News










Open Free Demat Account
Open Free Demat Account











Invest Anytime, Anywhere


By signing up I certify terms, conditions & privacy policy