Nifty 50
- Maruti Suzuki₹13,736324.00 (2.42%)
- Eicher Motors₹7,122-304.00 (-4.09%)
- Nestle₹1,416.1028.80 (2.08%)
- Tata Consumer ₹1,084.40-28.40 (-2.55%)
- Titan Company₹4,344.6067.40 (1.58%)
- Infosys₹1,011.70-25.00 (-2.41%)
- Bajaj Finance₹994.9512.90 (1.31%)
- Wipro₹171.29-4.19 (-2.39%)
- Bharti Airtel₹1,863.2022.10 (1.20%)
- TCS₹2,055.40-42.50 (-2.03%)
- Bajaj Finserv₹1,778.8019.50 (1.11%)
- ONGC₹229.60-4.45 (-1.90%)
- Adani Ports₹1,789.9013.80 (0.78%)
- Dr. Reddy's Labs₹1,350.20-25.50 (-1.85%)
- Adani Enterprises₹2,98118.50 (0.62%)
- HDFC Life Insurance ₹572.60-10.65 (-1.83%)
- InterGlobe Aviation₹5,341.6026.40 (0.50%)
- HCL Technologies₹1,085.60-16.80 (-1.52%)
- Sun Pharmaceutical₹1,884.109.30 (0.50%)
- ITC₹286.65-4.05 (-1.39%)
- Offerings
- Tools & Platforms
Tools & Calculators
- Open API
- Calculators
- SIP Calculator
- CAGR Calculator
- Compound Interest Calculator
- FD Calculator
- RD Calculator
- EPF Calculator
- Retirement Calculator
- HDFC SIP Calculator
- Mutual Fund Return Calculator
- Lumpsum Calculator
- Step Up SIP Calculator
- ETF SIP Calculator
- Brokerage Calculator
- Equity Margin Calculator
- SWP Calculator
- EMI Calculator
- MTF Calculator
- Margin Pledge Calculator
- Markets
Stocks
F&O
Mutual Funds
- More
Mastering Open Interest: A Trader’s Guide to Market Sentiment & Key Levels
By HDFC SKY | Updated at: Jun 20, 2025 10:09 AM IST
In the world of derivatives trading, price movements alone don’t tell the full story. Understanding market sentiment requires looking deeper into Open Interest (OI)—a powerful indicator that reveals trader participation and conviction behind price trends.
With the right tools, traders can analyze OI shifts in real time, making informed decisions with confidence. Let’s explore how OI works and how to use it effectively in trading.
What is Open Interest?
Open Interest refers to the total number of outstanding derivative contracts (futures or options) that haven’t been squared off yet. It fluctuates based on new positions being added or old positions being closed.Rising OI = More participation, signaling increased trader interest. Falling OI = Positions are being squared off, often signaling trend exhaustion.
Unlike volume, which resets daily, OI is cumulative, showing the overall market positioning over time.
Why Does OI Matter?
OI helps traders differentiate between a strong trend and a weak one. If a stock is rallying but OI is falling, the move might be driven by short covering rather than genuine buying interest.
Futures vs. Options: How OI Impacts Trading Decisions
OI in Futures Trading
In futures, Open Interest analysis is straightforward:
| OI | Price | Build Up | Indication |
| Increase | Increase | Long Buildup | Strong Bullish |
| Increase | Decrease | Short Buildup | Strong Bearish |
| Decrease | Increase | Short Covering | Bullish but Temporary |
| Decrease | Decrease | Long Unwinding | Bearish but Temporary |
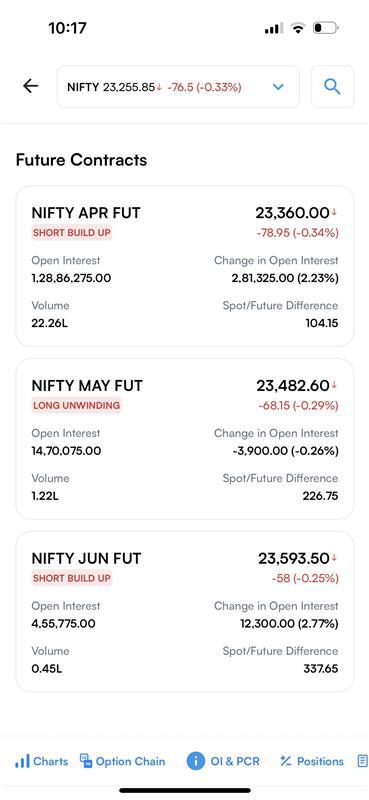
Let’s look at an example:
In the Future chain of our HDFC SKY app F&O Dashboard, NIFTY April Futures price reduced by 0.34% with 2.23% increasing OI, it signals strong selling pressure, confirming a Short Build Up – bearish trend.
OI in Options Trading
Options involve multiple strike prices, so along with the build-up, OI analysis is a bit more nuanced:
- High Call OI at a strike price = Indicates strong resistance; traders are writing calls, expecting the price to stay below this level.
- High Put OI at a strike price = Indicates strong support; traders are writing puts, expecting the price to stay above this level.
- Sudden rise in Call OI with price stagnation = Possible call writing (Bearish sign).
- Sudden rise in Put OI with price holding firm = Possible put writing (Bullish sign) Identifying Support & Resistance Using OI
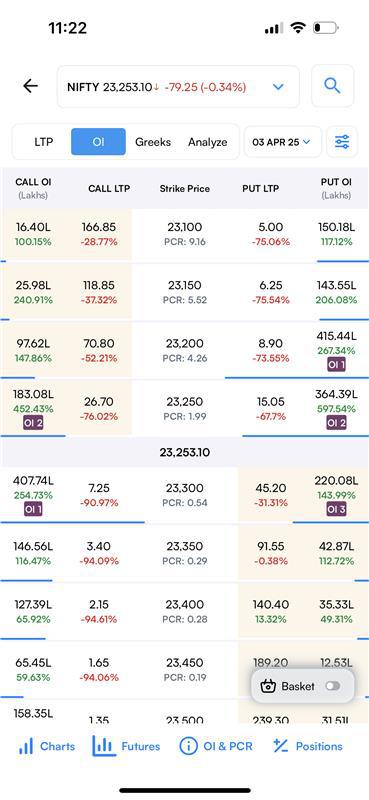
Take a look at this Nifty’s option chain. 23300 CE and 23200 PE have the highest OI indicating this as an immediate resistance and support range. The OI tagging in HDFC SKY’s option chain makes it easy to spot the immediate and wider ranges of support resistance.
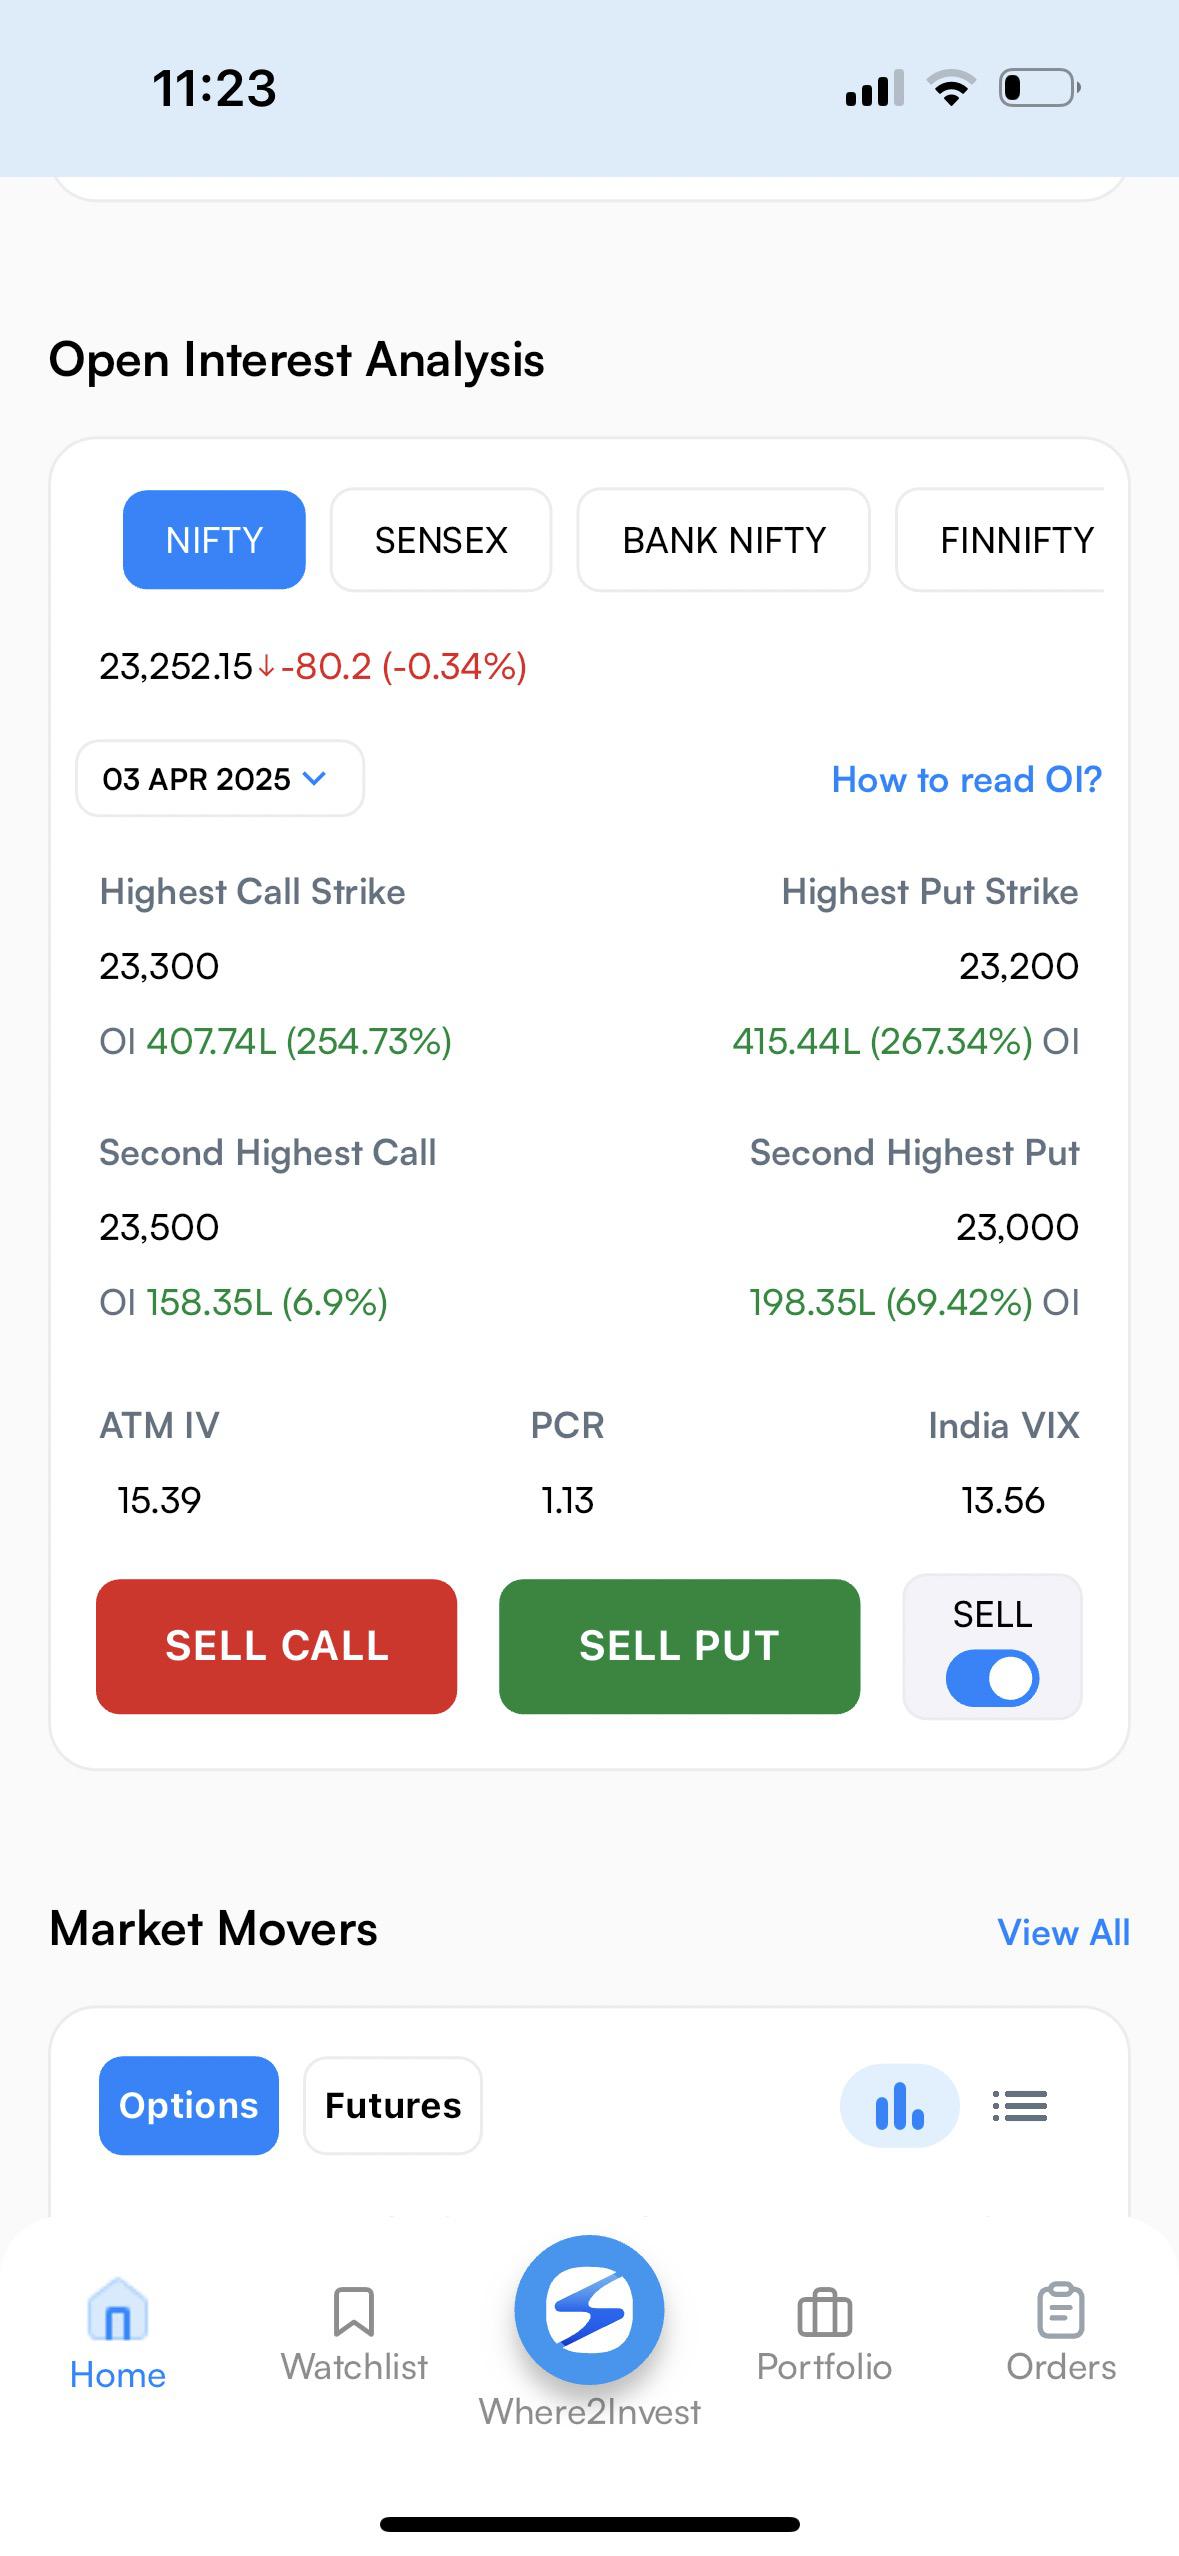
Let’s try to understand this with the Open Interest Analysis tool in HDFC SKY F&O Dashboard:
If 23,200 has the highest Put OI as shown above, it suggests that traders expect this level to hold as strong support. If the market starts falling below 23,200, put sellers might start unwinding, leading to further downside. Similarly, if 23,300 has the highest Call OI, it suggests resistance at this level. A breakout above 23,300 could trigger short covering in calls, leading to a strong rally.
Final Thoughts:
OI analysis is a game-changer for derivatives traders. It goes beyond just tracking price movements and offers a deeper look into market sentiment, positioning, and potential trend reversals.
In futures, OI trends clearly indicate bullish or bearish sentiment.- In options, OI helps spot key support & resistance zones and predict breakouts.- Tracking OI along with price helps traders identify fresh buying, short covering, profit booking, or aggressive short selling. By incorporating OI analysis into your trading strategy, you gain a powerful edge over those who rely solely on price charts. So, the next time you trade F&O, don’t just watch the price watch the OI in HDFC SKY’s F&O Dashboard!
FAQs
What is Open Interest (OI) in trading?
Open Interest refers to the total number of outstanding derivative contracts (futures or options) that haven’t been closed yet. It indicates trader participation and market sentiment.
How is Open Interest different from volume?
Volume resets daily and tracks the number of contracts traded during a day, while Open Interest is cumulative and reflects the total outstanding contracts over time.
Why is rising Open Interest significant?
Rising Open Interest signals increased trader participation, often indicating a strong trend, whether bullish or bearish.
How can OI help identify trend reversals?
For instance, if a stock is rallying but OI is falling, the move may be driven by short covering, suggesting temporary upward pressure rather than genuine buying interest.


By signing up I certify terms, conditions & privacy policy