Nifty 50
- Cipla₹1,39916.00 (1.16%)
- HDFC Life Insurance ₹526.90-34.60 (-6.16%)
- ONGC₹2392.10 (0.89%)
- Bajaj Finance₹982-61.20 (-5.87%)
- NTPC₹326.600.60 (0.18%)
- Axis Bank₹1,186.50-56.70 (-4.56%)
- Bajaj Finserv₹1,762.30-84.20 (-4.56%)
- Adani Enterprises₹2,900-93.20 (-3.11%)
- InterGlobe Aviation₹4,890-138.50 (-2.75%)
- Trent₹2,700-74.00 (-2.67%)
- Nestle₹1,351-36.20 (-2.61%)
- Asian Paints₹2,392.70-62.30 (-2.54%)
- Reliance Industries₹1,219.20-28.80 (-2.31%)

- Offerings
- Tools & Platforms
Tools & Calculators
- Open API
- Calculators
- SIP Calculator
- CAGR Calculator
- Compound Interest Calculator
- FD Calculator
- RD Calculator
- EPF Calculator
- Retirement Calculator
- HDFC SIP Calculator
- Mutual Fund Return Calculator
- Lumpsum Calculator
- Step Up SIP Calculator
- ETF SIP Calculator
- Brokerage Calculator
- Equity Margin Calculator
- SWP Calculator
- EMI Calculator
- MTF Calculator
- Margin Pledge Calculator
- Algo Strategy
- Markets
Stocks
F&O
Mutual Funds
- More
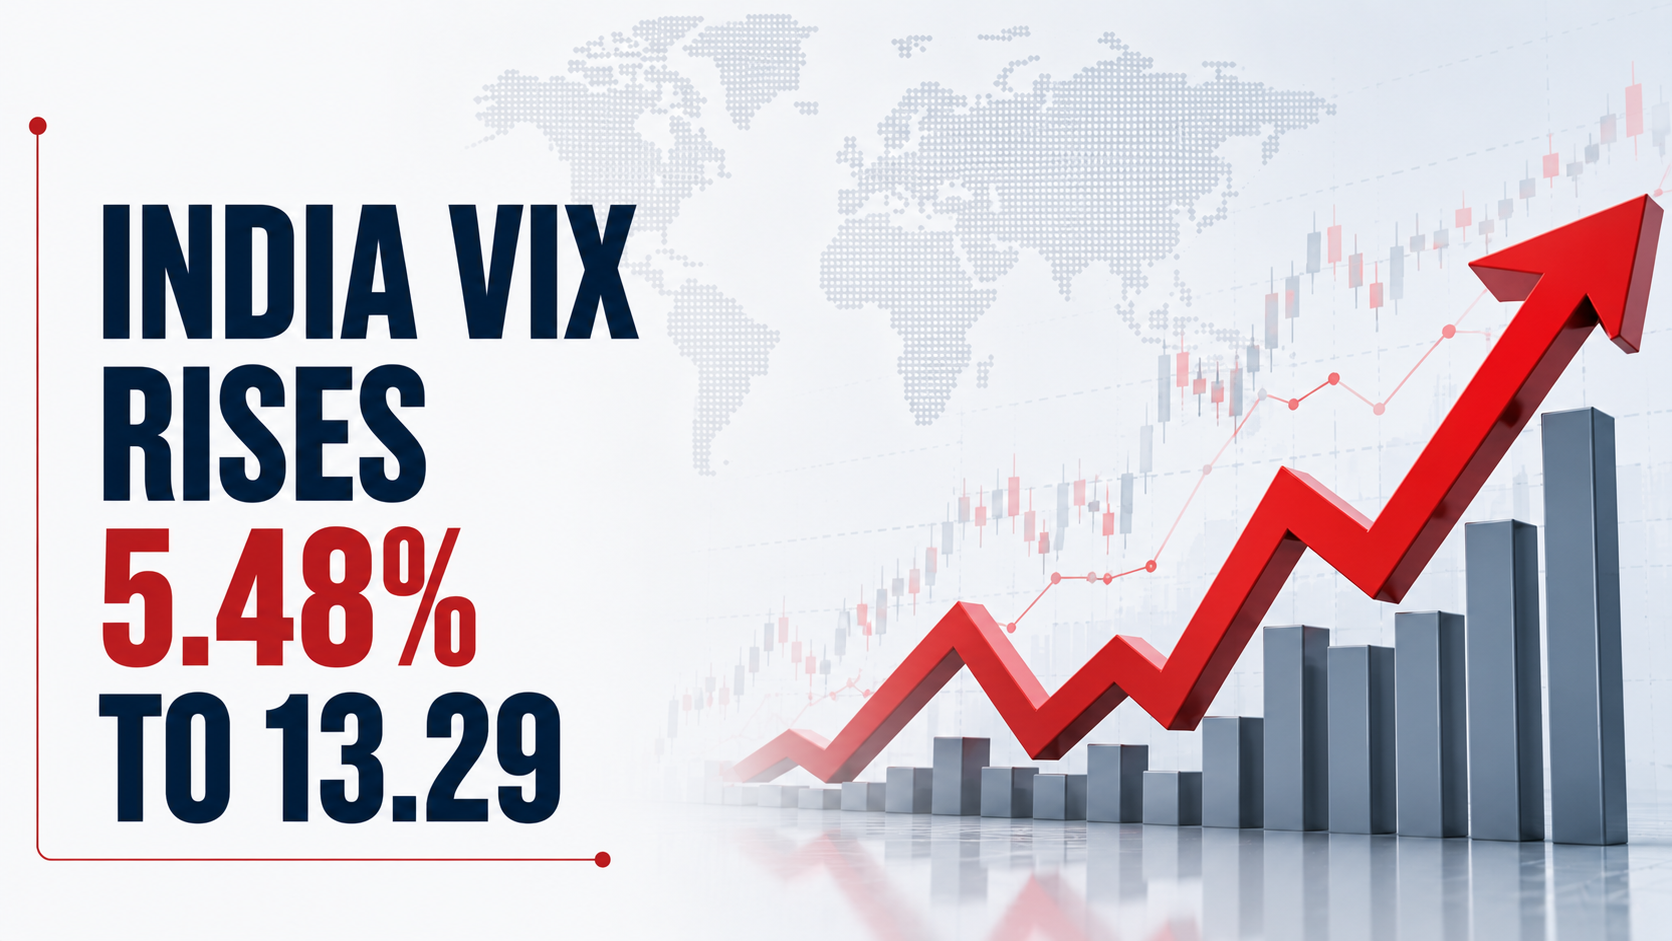
India VIX Rises 5.48% to 13.29 as Earnings, Global Risks and Derivatives Activity Keep Volatility Elevated
Authored By HDFC SKY | Last Modified: Jul 22, 2026 04:17 PM IST
Open Free Demat Account
Open Free Demat Account
Mumbai, July 22: India VIX ended the trading session on 22 July 2026 at 13.29, gaining 0.69 points (5.48%) from its previous close of 12.60, reflecting a modest increase in implied market volatility amid ongoing corporate earnings, geopolitical developments and derivatives positioning. During the session, the volatility index opened at 12.60, touched an intraday high of 13.42 and a low of 11.72, while remaining well within its 52-week range of 8.72 to 28.90. The benchmark has delivered a 40.19% year-to-date return, while its daily technical trend continues to remain Neutral.

India VIX Climbs to 13.29 As Volatility Normalises
The latest session marked a moderate rise in India VIX after the sharp volatility witnessed earlier this month eased significantly. Although the index moved higher by 5.48%, it continued to trade within the 12-13.5 range that has largely prevailed following the volatility spike recorded on 8 July 2026.
Earlier this month, India VIX had surged by nearly 26-30% in a single session, making it one of the sharpest one-day advances of the year. Since then, volatility has gradually moderated as option premiums normalised and broader market conditions stabilised. The latest movement indicates that implied volatility remains above the calmer levels seen before the July spike but well below historically elevated stress levels.
Technical indicators continue to classify the daily trend as Neutral, while the day’s classic pivot levels stood at 13.09 (R1), 13.58 (R2), 14.08 (R3), with the pivot point at 12.59 and support levels at 12.10, 11.60 and 11.11.
Geopolitical Risks and Crude Oil Continue Supporting Volatility
Market developments during the session continued to reflect the influence of broader macroeconomic and geopolitical factors rather than any India VIX-specific announcement.
According to the available market updates, geopolitical developments involving the United States and Iran, developments surrounding the Strait of Hormuz, and movements in international crude oil prices remained among the primary factors being monitored across global financial markets. Elevated crude oil prices continued to remain an important macroeconomic variable for India because of its dependence on imported crude.
At the same time, the ongoing Q1 FY27 corporate earnings season continued to support derivatives activity. Large-cap earnings announcements typically increase hedging activity and option positioning, contributing to relatively higher implied volatility even when broader market movements remain measured. As a result, India VIX remained around the 12-13 zone instead of falling towards lower historical levels.
Derivatives Positioning Keeps India VIX Above Calm-Market Levels
Derivatives activity continued to influence the volatility index throughout the trading session. Market participants maintained protective positioning through options, while implied volatility remained relatively stable after the sharp adjustment witnessed earlier in July.
Analysts noted that option writers continued to remain cautious, while institutional hedging activity helped prevent implied volatility from declining further. The current range therefore reflected ongoing risk management activity rather than extreme market stress.
Structural changes introduced during July also remained relevant. The Reserve Bank of India’s (RBI) tighter funding norms for broker proprietary trading desks have reduced leverage, influenced derivatives turnover and altered hedging behaviour across the market. Although these measures were implemented earlier this month, they continue to shape derivatives activity and volatility patterns.
July Seasonality Continues Showing Historically Weak Performance
Historical data continues to indicate that July has generally remained a weaker month for India VIX. Over the past 18 years, the volatility index has recorded negative returns during July in 15 years.
Seasonality analysis shows that the month has delivered a maximum positive change of 7.39% in 2011, while the average positive movement stands at 4.47%. Conversely, the maximum negative change reached 24.22% during 2022, with an average monthly decline of 10.77%. Overall, the average July movement remains at -8.23%, suggesting that volatility has historically softened after early-month event-driven spikes.
This year’s movement broadly follows that historical pattern, with the sharp volatility jump recorded during the first half of July gradually easing before stabilising within the current trading range.
Market Context Keeps Volatility Within The 12-13 Range
The latest trading session reflected a relatively balanced market environment in which volatility remained contained despite several external developments.
Broader market participants continued monitoring crude oil prices, foreign institutional investment flows, corporate earnings announcements, global equity market performance and monetary policy expectations. Together, these factors have continued influencing derivatives pricing without triggering unusually elevated volatility expectations.
Global volatility indicators also remained under observation, with the Cboe Volatility Index (VIX) in the United States recently moving higher amid geopolitical developments and weakness in parts of the technology sector. The movement suggested that volatility expectations have also risen across international markets, although India VIX remained well below historically stressed levels.
Based on commonly followed market classifications, India VIX below 12 generally reflects very calm market conditions, while the 12-15 range is typically associated with normal market volatility. Readings between 15 and 20 generally indicate elevated uncertainty, whereas levels above 20 are associated with heightened market stress. At 13.29, the index remained within the normal volatility range.
NSE Explores New Volatility Index Methodology
Separately, developments within India’s derivatives market continued to attract attention after the National Stock Exchange (NSE) indicated that it is exploring the launch of a new volatility index based on a revised methodology.
The exchange had previously introduced India VIX futures in 2014, although those contracts were discontinued in 2017 because of limited participation and liquidity. The proposed index is expected to adopt an updated calculation methodology and may initially be introduced on a pilot basis.
While the proposal does not directly affect the spot India VIX reading for 22 July 2026, it represents an ongoing development within India’s broader volatility derivatives ecosystem and could expand the range of volatility-related products available in future.
India VIX Remains Neutral Despite Today’s 5.48% Rise
Despite ending the session 5.48% higher at 13.29, India VIX continued to remain considerably below the elevated levels witnessed earlier this month and well below its 52-week high of 28.90. The absence of any standalone regulatory announcement or methodology change affecting India VIX meant that the day’s movement largely reflected ongoing adjustments linked to corporate earnings, geopolitical developments, crude oil prices and derivatives positioning. The technical trend also remained Neutral, indicating no change in the prevailing daily technical assessment.
India VIX closed at 13.29, up 5.48%, while remaining within the 12-13.5 trading range that has prevailed after the early July volatility spike. The session reflected the continued influence of corporate earnings, geopolitical developments, crude oil prices, derivatives activity and broader market positioning, with no standalone India VIX-specific announcement reported during the day.
Source
- https://www.nseindia.com/reports-indices-historical-vix
Disclaimer
If you have any concerns, questions, or wish to point out any discrepancies in our content, please feel free to write to us at content@hdfcsec.com.
Please Note: The information shared is intended solely for informational purposes and does not make any investment recommendations
Disclaimer
At HDFC SKY*, we take utmost care and due diligence in curating and presenting news and market-related content. However, inadvertent errors or omissions may occasionally occur.
If you have any concerns, questions, or wish to point out any discrepancies in our content, please feel free to write to us at content@hdfcsec.com.
Please Note: The information shared is intended solely for informational purposes and does not make any investment recommendations.
HDFC SKY from HDFC Securities, one of most trusted trading platforms in India, has been recognized with the *Next-Gen Digi Content Awards 2025-26.
 Join Us
 Add as preferred source on Google


More Business News






Open Free Demat Account
Open Free Demat Account










Invest Anytime, Anywhere


By signing up I certify terms, conditions & privacy policy