Nifty 50
- Dr. Reddy's Labs₹1,229.4032.40 (2.71%)
- Apollo Hospitals₹7,775-252.50 (-3.15%)
- Bajaj Auto₹10,034256.00 (2.62%)
- ITC₹257.90-8.10 (-3.05%)
- Tata Motors PV₹284.454.55 (1.63%)
- Tech Mahindra₹1,471-43.10 (-2.85%)
- Bharat Electronics₹373.905.75 (1.56%)
- L&T₹3,627.50-75.80 (-2.05%)
- BSE₹3,330.2043.00 (1.31%)
- Max Healthcare₹865.95-17.85 (-2.02%)
- Cipla₹1,317.4016.40 (1.26%)
- Hindalco Industries₹882.50-17.85 (-1.98%)
- Eicher Motors₹7,11969.00 (0.98%)
- Hindustan Unilever₹1,820.70-36.00 (-1.94%)
- Mahindra & Mahindra₹2,81316.80 (0.60%)
- SBI₹941-18.10 (-1.89%)
- Kotak Mahindra Bank₹443.402.40 (0.54%)
- Coal India₹404.80-6.75 (-1.64%)
- HCL Technologies₹1,2236.30 (0.52%)
- Bharti Airtel₹1,778.70-26.40 (-1.46%)

- Offerings
- Tools & Platforms
Tools & Calculators
- Open API
- Calculators
- SIP Calculator
- CAGR Calculator
- Compound Interest Calculator
- FD Calculator
- RD Calculator
- EPF Calculator
- Retirement Calculator
- HDFC SIP Calculator
- Mutual Fund Return Calculator
- Lumpsum Calculator
- Step Up SIP Calculator
- ETF SIP Calculator
- Brokerage Calculator
- Equity Margin Calculator
- SWP Calculator
- EMI Calculator
- MTF Calculator
- Margin Pledge Calculator
- Algo Strategy
- Markets
Stocks
F&O
Mutual Funds
- More
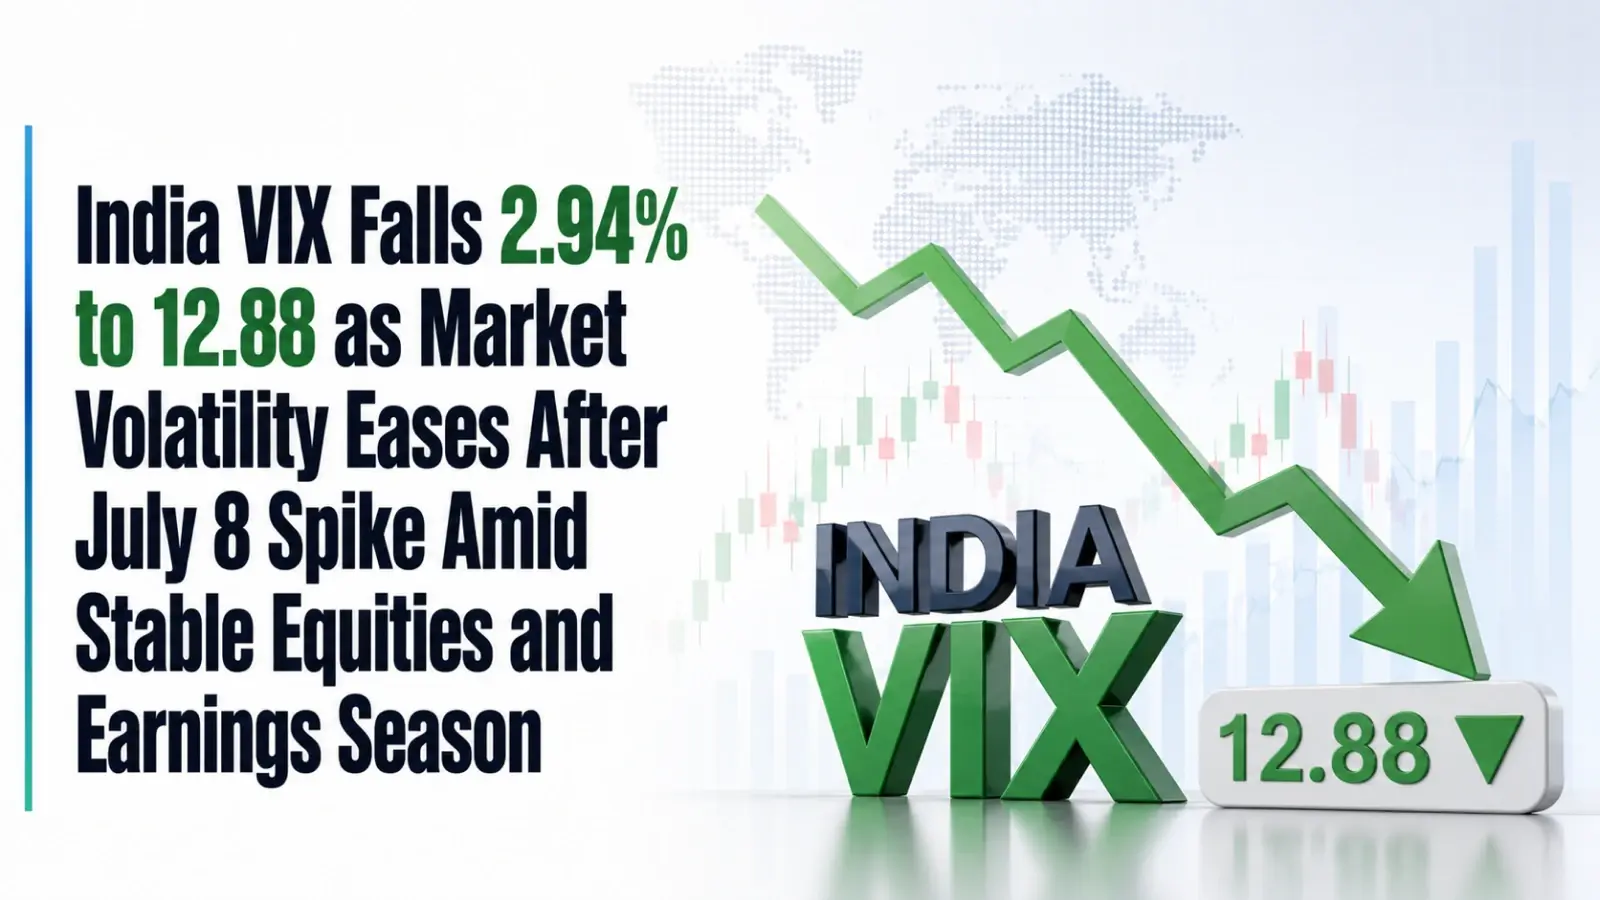
India VIX Falls 2.94% to 12.88 as Market Volatility Eases After July 8 Spike Amid Stable Equities and Earnings Season
Authored By HDFC SKY | Last Modified: Jul 17, 2026 08:40 AM IST
Open Free Demat Account
Open Free Demat Account
Mumbai, July 16: India VIX, the National Stock Exchange’s volatility index, ended Thursday’s session lower as market uncertainty eased following the sharp volatility witnessed earlier this month. The index closed at 12.88, down 0.39 points (2.94%), after opening at 13.27, which also remained the day’s high, before touching an intraday low of 12.77. The moderation came after the volatility gauge had surged sharply on 8 July 2026, reflecting calmer market conditions even as participants continued tracking geopolitical developments, crude oil prices and the ongoing Q1 FY27 corporate earnings season.

India VIX Ends at 12.88 After Touching 12.77 Intraday Low
India VIX remained under pressure throughout the trading session, settling at 12.88, compared with the previous close of 13.27. The index traded within a narrow range of 12.77-13.27, indicating that volatility expectations softened during the day. Despite the decline, the volatility gauge remained above the levels seen in early July before the sharp market-wide spike. On a broader basis, India VIX continues to trade well below its 52-week high of 28.90, while remaining comfortably above its 52-week low of 8.72. The index has also delivered a 35.86% year-to-date return, highlighting that implied volatility remains elevated compared with the beginning of the year.
July 8 Surge Continues to Shape Market Volatility Narrative
Although Thursday’s session reflected easing volatility, market attention remained focused on the sharp movement recorded on July 8, when India VIX climbed by nearly 26% to 30% intraday. The volatility gauge rose to around 15.15 before settling at 14.68, marking one of its strongest single-day advances in recent months. The move followed a period of relatively subdued volatility, with the index trading below 12 on 3 July and hovering around 11.8 on 7 July. The sharp increase reflected a sudden shift in near-term market uncertainty after several weeks of comparatively stable trading conditions.
Middle East Tensions and USD 85-86 Oil Supported Volatility
The July 8 jump in India VIX coincided with renewed geopolitical tensions involving the United States and Iran, which raised concerns over potential disruptions to global crude oil supplies and shipping routes through the Strait of Hormuz. At the same time, Brent crude oil remained around USD 85-86 per barrel, extending gains over multiple trading sessions. Elevated energy prices added to uncertainty surrounding inflation and input costs, particularly for an economy that imports a substantial portion of its crude oil requirements. These developments collectively contributed to higher implied volatility in the options market during the period.
Equity Recovery Reduced Near-Term Volatility Expectations
Thursday’s decline in India VIX came alongside a relatively stable performance in domestic equities. During the session, the Sensex advanced by more than 200 points to 77,388, while the Nifty 50 gained around 64 points to 24,142. Information technology stocks, including HCL Technologies, Infosys, Tech Mahindra and Tata Consultancy Services (TCS), recorded gains of 1-3%, while broader indices also traded higher, with the Nifty Midcap 100 and Nifty Smallcap 100 rising by up to 0.5%. The moderation in volatility coincided with these steadier market movements after last week’s sharp fluctuations.
Earlier Sell-Off Drove Sharp Rise in Protective Hedging
The earlier surge in India VIX unfolded alongside one of the month’s steepest declines in Indian equities. During that session, the Sensex fell by around 1,677 points, while the Nifty dropped by more than 500 points, slipping below the 24,000 level. The broad-based decline resulted in an erosion of nearly ₹8 lakh crore in investor wealth as selling pressure extended across multiple sectors. Market reports also indicated increased demand for protective put options during the period, resulting in higher option premiums and contributing to the sharp increase in implied volatility measured by India VIX.
Earnings Season and Options Data Kept Traders Watchful
The ongoing Q1 FY27 earnings season remained one of the principal developments influencing market activity. Corporate earnings announcements across sectors continued to attract attention as companies released quarterly financial results and management commentary. At the same time, derivatives data reflected continued positioning around key index levels. The Put-Call Ratio (PCR) stood at 0.77, while options data showed the highest Put Open Interest at the 24,000 strike, indicating a key support zone, and the highest Call Open Interest at the 24,200 strike, marking a significant resistance level during the session.
Neutral Technical Rating Signals Stable Volatility Trend
Technical indicators continued to assign India VIX a Neutral trend rating, indicating that implied volatility has stabilised after recent fluctuations without signalling a decisive directional shift. For Thursday’s session, the Classic Pivot Point stood at 13.39, with resistance levels placed at 13.75, 14.22 and 14.58, while support levels were identified at 12.92, 12.56 and 12.09. These levels are calculated using the previous trading session’s price range and serve as reference points for intraday market activity.
July History Shows 15 of 18 Years Ended Lower
Historical seasonality data continued to highlight July as a month in which India VIX has generally recorded weaker performance. Over the past 18 years, the index has posted negative returns in 15 July trading periods. The month has delivered an average decline of 8.41%, while the maximum positive July gain stands at 7.39% recorded in 2011. Conversely, the steepest July decline reached 24.22% in 2022, with the average positive July gain measured at 4.47% and the average negative decline at 10.99%.
India VIX is the National Stock Exchange’s benchmark volatility index derived from the implied volatility of Nifty 50 options contracts. Often referred to as the market’s “fear gauge”, it reflects expected market volatility over the near term rather than the direction of equity prices. The index is widely monitored alongside benchmark indices to assess changes in expected market fluctuations and currently remains within its 52-week range of 8.72 to 28.90.
India VIX closed 2.94% lower at 12.88 on 16 July 2026, indicating that market volatility moderated following the sharp spike recorded on 8 July. Geopolitical developments, crude oil prices, domestic equity performance and the ongoing Q1 FY27 earnings season continued to remain the key developments influencing the volatility index during the session.
Source
- https://www.nseindia.com/reports-indices-historical-vix
Disclaimer
If you have any concerns, questions, or wish to point out any discrepancies in our content, please feel free to write to us at content@hdfcsec.com.
Please Note: The information shared is intended solely for informational purposes and does not make any investment recommendations
Disclaimer
At HDFC SKY*, we take utmost care and due diligence in curating and presenting news and market-related content. However, inadvertent errors or omissions may occasionally occur.
If you have any concerns, questions, or wish to point out any discrepancies in our content, please feel free to write to us at content@hdfcsec.com.
Please Note: The information shared is intended solely for informational purposes and does not make any investment recommendations.
HDFC SKY from HDFC Securities, one of most trusted trading platforms in India, has been recognized with the *Next-Gen Digi Content Awards 2025-26.
 Join Us
 Add as preferred source on Google


More Business News










Open Free Demat Account
Open Free Demat Account












Invest Anytime, Anywhere


By signing up I certify terms, conditions & privacy policy