Nifty 50
- ITC₹263.805.80 (2.25%)
- TCS₹2,198.80-52.20 (-2.32%)
- Nestle₹1,39129.00 (2.13%)
- Wipro₹166.96-3.04 (-1.79%)
- HDFC Life Insurance ₹526.8510.75 (2.08%)
- Infosys₹1,059.30-17.70 (-1.64%)
- Tata Consumer ₹1,006.6020.50 (2.08%)
- Tech Mahindra₹1,555-20.90 (-1.33%)
- Trent₹2,783.4053.40 (1.96%)
- Tata Motors PV₹300.75-2.85 (-0.94%)
- SBI₹986.9018.90 (1.95%)
- L&T₹3,817.20-33.50 (-0.87%)
- Axis Bank₹1,246.4023.50 (1.92%)
- InterGlobe Aviation₹4,737-39.00 (-0.82%)
- Hindalco Industries₹974.7016.00 (1.67%)
- Bajaj Finserv₹1,841.80-13.70 (-0.74%)
- Hindustan Unilever₹1,966.5028.40 (1.47%)
- Shriram Finance₹974.20-5.60 (-0.57%)
- Asian Paints₹2,437.7034.90 (1.45%)
- Tata Steel₹182.80-0.85 (-0.46%)

- Offerings
- Tools & Platforms
Tools & Calculators
- Open API
- Calculators
- SIP Calculator
- CAGR Calculator
- Compound Interest Calculator
- FD Calculator
- RD Calculator
- EPF Calculator
- Retirement Calculator
- HDFC SIP Calculator
- Mutual Fund Return Calculator
- Lumpsum Calculator
- Step Up SIP Calculator
- ETF SIP Calculator
- Brokerage Calculator
- Equity Margin Calculator
- SWP Calculator
- EMI Calculator
- MTF Calculator
- Margin Pledge Calculator
- Algo Strategy
- Markets
Stocks
F&O
Mutual Funds
- More
Nasdaq Falls 205 Points, Dow Sheds 328 as Treasury Yield Hits 5.041%
Authored By HDFC SKY | Last Modified: Sep 16, 2026 08:56 AM IST
Open Free Demat Account
Open Free Demat Account
Mumbai, Sept 16: US equity indices closed lower for the second consecutive session on Tuesday, with the technology-heavy Nasdaq Composite leading declines as the benchmark 10-year Treasury yield touched 5.041%, its highest intraday level since July 2007, and Brent crude futures settled above $108 per barrel amid escalating Middle East supply disruptions.
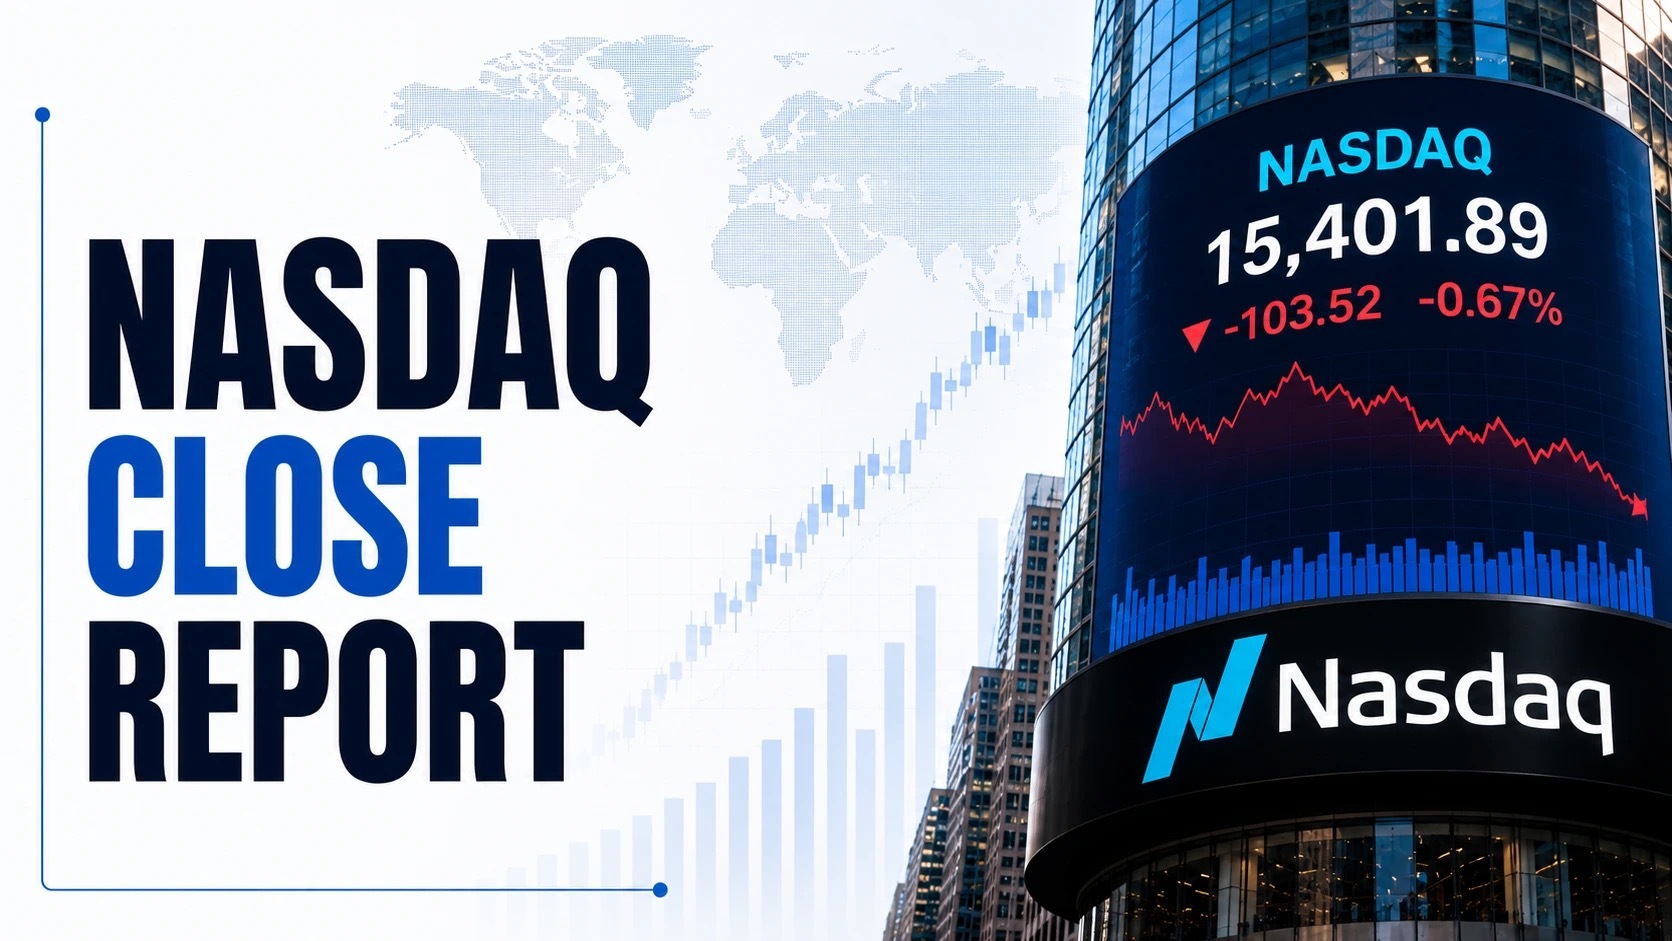
The Dow Jones Industrial Average fell 328.09 points, or 0.63%, to close at 52,093.11, while the S&P 500 declined 34.25 points, or 0.45%, to end at 7,585.73. The Nasdaq Composite dropped 204.84 points, or 0.78%, settling at 25,981.57.
The simultaneous rise in oil prices and government bond yields, combined with near-certain expectations of a Federal Reserve rate hike on Wednesday, exerted broad pressure across cyclical, consumer-facing and rate-sensitive sectors, leaving the S&P 500 Energy sector as the sole industry group in positive territory for the day.

Dow Jones Falls 328 Points to 52,093 as Energy and Financials Diverge Sharply
The Dow Jones Industrial Average closed at 52,093.11, down 328.09 points or 0.63%, after opening at 52,303.24. The index traded within a range of 51,875.65 to 52,336.61 during the session. The previous close stood at 52,421.20. The index is now trading approximately 4.8% below its 52-week high of 54,744.33, though it remains well above the 52-week low of 45,057.28. Trading volume on the Dow tracked 374.47 million shares, below the average volume of approximately 495.83 million shares.
Among index constituents, energy and industrial names provided partial offset to broader weakness. Chevron advanced 2.64% to close at $217.77, while 3M gained 1.64% to $164.67 and Honeywell International rose 1.02% to $203.44. On the downside, Nike declined 2.24% to $36.22, Amazon fell 2.02% to $248.42, and Walt Disney dropped 2.00% to $106.42.
S&P 500 Drops 34 Points to 7,585 as 10-Year Yield Nears 5% Threshold
The S&P 500 declined 34.25 points, or 0.45%, to close at 7,585.73, having opened at 7,612.30 and traded between 7,572.69 and 7,617.26. The index’s previous close was 7,619.98. With the 10-year Treasury yield hovering around the 5.00% mark and touching an intraday high of 5.041%, valuation-sensitive sectors faced persistent selling pressure.
The index remains approximately 3% below its 52-week high of 7,816.70 and significantly above its 52-week low of 6,316.91. Volume on the S&P 500 stood at approximately 2.79 billion shares, compared with an average of around 5.18 billion shares. Among S&P 500 constituents, Skyworks Solutions surged 13.55% to $90.00, Qorvo gained 9.34% to $118.06, and Revvity rose 9.11% to $140.19. Conversely, Axon Enterprise tumbled 9.81% to $442.08, Jack Henry declined 6.37% to $154.07, and Chipotle Mexican Grill dropped 5.94% to $34.83.
Nasdaq Composite Slides 0.78% to 25,981 as Semiconductor Strength Provides Limited Cushion
The Nasdaq Composite fell 204.84 points, or 0.78%, to close at 25,981.57, after opening at 26,140.23. The index traded between 25,943.31 and 26,172.12 during the session, with the previous close at 26,186.41. Volume on the Nasdaq reached approximately 6.90 billion shares, below the average volume of around 8.75 billion shares. The index is now approximately 4.4% below its 52-week high of 27,190.21 and remains more than 25% above its 52-week low of 20,690.25.
Semiconductor-related strength provided a partial counterweight to broader technology weakness, though the gains were insufficient to lift the composite into positive territory. Mega-cap technology constituents were mixed, with the Roundhill Magnificent Seven ETF declining approximately 0.7%. Crypto-linked equities faced pronounced selling pressure, with Circle Internet Group dropping over 11%, Coinbase Global falling more than 10%, and Strategy declining over 5%.
Also Read: What Is the New York Stock Exchange (NYSE)?
Russell 2000 Declines 22 Points to 2,870 as Small-Cap Weakness Persists
The Russell 2000 Index closed at 2,870.29, down 21.95 points or 0.76%, after opening at 2,890.64. The small-cap benchmark traded between 2,861.73 and 2,890.64 during the session, with the previous close at 2,892.24.
The index remains approximately 6.5% below its 52-week high of 3,069.71 and is up significantly from its 52-week low of 2,303.46. Small-cap stocks faced dual pressures from elevated borrowing costs and concerns about the sustainability of consumer spending. Healthcare and biotechnology constituents registered notable declines, with several names falling more than 5%, including Arrowhead Pharmaceuticals which dropped 12.40%.
S&P 100 Falls 16 Points to 3,770 as Mega-Cap Cohort Turns Mixed
The S&P 100 Index declined 16.25 points, or 0.43%, to close at 3,770.84, after opening at 3,782.00. The index traded between 3,763.41 and 3,787.42, with the previous close at 3,787.09. The mega-cap benchmark remains approximately 2.1% below its 52-week high of 3,853.17 and well above its 52-week low of 3,074.00. The mixed performance within the mega-cap cohort reflected selective weakness in technology and consumer-facing constituents, partially offset by gains in energy-linked and certain industrial heavyweights. The divergence within the mega-cap space underscored the market’s selective approach to valuation in a rising rate environment.
Dow Jones Composite Slips 100 Points, Transportation and Utility Averages Weaken on Yields
The Dow Jones Composite Average closed at 16,377.96, down 100.09 points or 0.61%, after opening at 16,450.02. The index traded between 16,318.05 and 16,472.04, with the previous close at 16,478.05. The Dow Jones Transportation Average declined 79.99 points, or 0.39%, to close at 20,649.80, trading between 20,527.71 and 20,784.45. The Dow Jones Utility Average fell 10.66 points, or 1.01%, to close at 1,048.43, touching an intraday low of 1,047.81, which marked a fresh 52-week low. The utility average’s decline reflected the competitive pressure from rising Treasury yields, which diminish the relative appeal of dividend-paying utility equities. The transportation average’s decline was driven by concerns over fuel costs and broader economic growth uncertainties.
PHLX Semiconductor Index Gains 44 Points to 11,175 as Chip Stocks Defy Market Downturn
The PHLX Semiconductor Sector Index advanced 44.27 points, or 0.40%, to close at 11,175.55, having opened at 11,233.04 and traded between 11,128.88 and 11,304.24. The previous close stood at 11,131.28. The index remains approximately 23.7% below its 52-week high of 14,655.29 and substantially above its 52-week low of 5,980.24.
The positive close marked a partial recovery from the previous session’s sharp selloff, which followed a safety warning from leading artificial intelligence firms. Semiconductor stocks, including advanced micro-devices and memory manufacturers, attracted selective buying interest even as the broader market declined. Qualcomm advanced over 4%, while Advanced Micro Devices gained approximately 2%.
NYSE Composite Falls 77 Points to 24,128 as Breadth Remains Negative
The NYSE Composite Index closed at 24,128.46, down 76.93 points or 0.32%, after opening at 24,205.39. The index traded between 24,063.91 and 24,205.39 during the session, with the previous close at 24,205.39. The index is approximately 3% below its 52-week high of 24,866.75 and above its 52-week low of 20,906.44. Declining issues outnumbered advancing issues across NYSE-listed securities, reflecting the broad-based nature of the selling pressure despite pockets of strength in energy and select technology subsectors.
Also Read: How to invest in US Stocks
S&P MidCap 400 and SmallCap 600 Decline 0.45% and 0.53% on Consumer Weakness
The S&P MidCap 400 Index fell 16.70 points, or 0.45%, to close at 3,662.50, after opening at 3,679.20 and trading between 3,657.11 and 3,685.96. The previous close was 3,679.20. The S&P SmallCap 600 Index declined 9.17 points, or 0.53%, to close at 1,704.89, having opened at 1,714.21 and traded between 1,701.17 and 1,714.21, with a previous close of 1,714.06. Mid-cap and small-cap indices faced pressure from weakness in consumer discretionary and healthcare constituents, compounded by elevated financing costs.
Market Drivers: Fed Rate Hike Bets, 19-Year High Treasury Yields and $108 Oil Weigh on Indices
The primary catalyst driving Tuesday’s declines was the convergence of three macroeconomic forces. First, the Federal Open Market Committee began its two-day meeting on Tuesday, with traders assigning a 93% to 95% probability of a 25 basis point rate hike on Wednesday, according to futures market pricing. This would represent the first rate increase in more than three years, bringing the target range to 3.75% to 4.00%. Second, the 10-year Treasury yield rose to 5.041% intraday, its highest since July 2007, before settling around 5.00%, elevating the risk-free rate against which equity valuations are measured.
Third, Brent crude futures for November delivery rose nearly 3% to settle at $108.75 per barrel, while West Texas Intermediate advanced more than 4% to $105.83, following the shutdown of Saudi Arabia’s East-West pipeline and fresh attacks by Iran-backed Houthi forces in the Red Sea. These factors collectively raised concerns about inflation persistence, corporate borrowing costs and consumer discretionary spending capacity.
Volatility Index Rises 0.58% to 17.20 as Rate Uncertainty Elevates Hedging Demand
The CBOE Volatility Index closed at 17.20, up 0.10 points or 0.58%, after opening at 17.57 and trading between 16.79 and 18.03. The previous close was 17.10. The index remains well below its 52-week high of 35.30 and above its 52-week low of 13.38.
The modest rise in the volatility gauge reflects heightened demand for downside protection ahead of the Federal Reserve’s policy decision, though the absolute level remains below the long-term average, suggesting that market participants are not pricing in extreme near-term dislocations.
The CBOE Nasdaq Volatility Index (VXN) stood at approximately 21.07, reflecting implied volatility in the Nasdaq 100 over the next month. The CBOE S&P 500 3-Month Volatility Index (VIX3M) traded around 17.61, up approximately 1.09%, indicating that medium-term volatility expectations remain moderately elevated.
Energy Sole Gainer as Consumer Discretionary and Communication Services Lead Declines
The S&P 500 Energy sector was the only one of 11 sectors to close in positive territory, rising approximately 1%, supported by the surge in crude oil prices. Within the sector, exploration and production companies advanced alongside integrated majors and oilfield services providers.
The Consumer Discretionary sector was the worst performer, declining approximately 1.4%, as elevated oil prices and rate hike expectations weighed on discretionary spending outlooks. The Communication Services sector fell about 1.1%, pressured by weakness in media and interactive entertainment constituents. Information Technology declined modestly, with losses concentrated in software and services, partially offset by semiconductor gains.
Financials were mixed, with banks relatively stable while capital markets-sensitive names weakened. Health Care, Industrials, Consumer Staples, Utilities, Real Estate and Materials all closed lower, with Utilities particularly affected by the 5% Treasury yield environment. The Energy sector’s gain was driven by the surge in crude oil prices, which lifted integrated majors and exploration companies. The Consumer Discretionary sector’s decline reflected concerns about the impact of sustained high energy costs on consumer spending capacity.
Market Breadth Negative as Semiconductor, Energy and Financial Stocks Diverge
Market breadth was decisively negative, with declining issues significantly outnumbering advancing issues across major exchanges. The semiconductor group was a notable outlier on the positive side, with the PHLX Semiconductor Index rising 0.40% and several chipmakers registering gains exceeding 2%. Memory and equipment manufacturers also advanced selectively.
Energy stocks broadly participated in the rally driven by crude oil’s surge, with integrated majors and exploration companies posting gains. Financial stocks were bifurcated, with traditional banks relatively stable while capital markets-exposed institutions weakened. The mega-cap technology cohort, represented by the Magnificent Seven ETF, declined approximately 0.7%, with mixed performance across constituents.
The day’s weakest sectors were consumer discretionary, communication services and health care, reflecting concerns about the interest rate and energy price environment.
Also Read: US Stock Market Timings
Skyworks Leads S&P 500 with 13.55% Gain as Enova Plunges 23.43% and Magnificent Seven Slips 0.7%
Among individual US equities, Skyworks Solutions was the standout performer, surging 13.55% to $90.00 on trading volume of 11.9 million shares, followed by Tempus AI which gained 10.67% to $68.85, Forgent Power Solutions which rose 9.50% to $31.36 on volume of 31.6 million shares, and Revvity which added 9.07% to $140.14. Caris Life Sciences advanced 9.40% to $28.50 and Qorvo gained 9.34% to $118.06. On the losing side, Enova International plummeted 23.43% to $173.61 after the fintech firm withdrew its regulatory applications for a proposed bank acquisition, while Alignment Healthcare tumbled 19.86% to $10.37.
Arrowhead Pharmaceuticals dropped 12.40% to $70.67, Wingstop fell 12.09% to $100.84, and Circle Internet Group declined 11.41% to $86.30. Axon Enterprise sank 9.81% to $442.08 after announcing a convertible notes offering, and Coinbase Global dropped 10.10% to $172.11. Among the Magnificent Seven mega-cap cohort, performance was mixed.
The Roundhill Magnificent Seven ETF declined approximately 0.7%. Meta Platforms gained 0.70% and Nvidia advanced 0.57%, while Microsoft fell 1.64%, Alphabet declined 1.26%, Amazon dropped 2.02%, Netflix fell 3.01%, and Tesla slipped 0.67%. Apple declined 0.52% and Broadcom lost 1.58%.
Economic Data: Consumer Spending Rises 4.5% in August Despite Inflation Pressures
Bank of America survey data released on Tuesday indicated that total credit and debit card spending rose 4.5% year-on-year in August, more than four times the average pace recorded in the prior year. Month-on-month spending accelerated by 0.9%. Excluding gasoline, spending rose 3.7% year-on-year. The data suggested that consumer spending remained resilient through the summer despite persistent above-target inflation, with the survey’s authors noting that consumers appeared to be increasing spending by choice rather than necessity.
Gasoline prices, elevated by the Middle East supply disruptions, contributed to the headline spending increase and have complicated the Federal Reserve’s inflation outlook. Average hourly earnings in inflation-adjusted terms have trended lower since February, declining 0.7% between February and August, as consumer price increases outpaced wage growth.
Federal Reserve Meeting Begins as Rate Hike Probability Reaches 93% and Bond Yields Hit 19-Year High
The Federal Open Market Committee commenced its September meeting on Tuesday, with financial markets pricing a 93% to 95% probability of a 25 basis point increase in the federal funds rate, according to CME FedWatch data. The decision, scheduled for release on Wednesday at 2:00 PM Eastern Time, would bring the target range to 3.75% to 4.00%, representing the first rate hike in more than three years. The 10-year Treasury yield rose 4.7 basis points to 5.008% after touching 5.041%, its highest since July 2007.
The 30-year Treasury yield climbed above 5.40%, touching its highest level since June 2007. The 2-year Treasury yield, most sensitive to monetary policy expectations, rose to approximately 4.68%, its highest since July 2024. The 5-year Treasury yield traded around 4.85%.
The yield curve has been steepening, with shorter-dated yields anchored by policy expectations while longer-dated yields rise on inflation and deficit concerns. The US dollar index strengthened to 99.66, up 0.27%, near a two-week high, as higher yields attracted foreign capital.
Also Read: What Are Fractional Shares
Brent Tops $108 on Pipeline Shutdown, Gold Slips to $4,296
Brent crude oil futures for November delivery closed at $108.75 per barrel, up nearly 3%, while West Texas Intermediate futures settled at $105.83, up more than 4%. The surge followed Saudi Arabia’s closure of its East-West pipeline, which carries up to 7 million barrels per day to the Red Sea port of Yanbu, after attacks by Iran-backed Houthi forces.
Exports from Yanbu fell below 2 million barrels per day in August. Physical market benchmarks, including Dated Brent, traded above $130 per barrel. Gold futures declined 0.07% to $4,296.23 per ounce, pressured by the stronger dollar and rising Treasury yields. Silver traded at approximately $68 per ounce.
Copper prices touched a three-week low of $14,084 per metric ton, reflecting growth concerns. Natural gas futures rose 0.8% to $2.919 per million British thermal units on production declines and above-normal temperature forecasts. The US Dollar Index stood at 99.66, up 0.27%. The euro traded at 1.155 against the dollar, while the Japanese yen weakened to 154.955. The British pound traded at approximately 1.34 against the dollar.
US equity indices closed lower for the second consecutive session as the 10-year Treasury yield touched a 19-year high of 5.041%, Brent crude exceeded $108 per barrel and markets priced a 93% probability of a Federal Reserve rate hike. The Fed’s decision on Wednesday, along with updated economic projections, will provide the next directional signal. Investors should monitor the 10-year yield’s trajectory around the 5% threshold, developments in Middle East energy infrastructure and the Federal Reserve’s forward guidance language for indications of policy duration.
Source
- https://www.nasdaq.com/
- spglobal.com/spdji/en/indices/equity/sp-500/
- https://www.dowjones.com/
- https://www.spglobal.com/spdji/en/indices/equity/dow-jones-industrial-average/
- https://www.spglobal.com/spdji/en/indices/equity/sp-500/
- https://www.nasdaq.com/market-activity/index/comp
- https://www.nasdaq.com/market-activity/quotes/nasdaq-ndx-index
- https://www.spglobal.com/spdji/en/indices/equity/sp-100/
- https://www.lseg.com/en/ftse-russell/indices/russell-us
- https://www.nyse.com/index
- https://www.nyse.com/index
- https://www.spglobal.com/spdji/en/indices/equity/dow-jones-transportation-average/
- https://www.spglobal.com/spdji/en/indices/equity/dow-jones-utility-average/
- https://www.spglobal.com/spdji/en/indices/equity/dow-jones-composite-average/
- https://www.nasdaq.com/market-activity/index/sox
- https://www.cboe.com/tradable_products/vix/
Disclaimer
At HDFC SKY*, we take utmost care and due diligence in curating and presenting news and market-related content. However, inadvertent errors or omissions may occasionally occur.
If you have any concerns, questions, or wish to point out any discrepancies in our content, please feel free to write to us at content@hdfcsec.com.
Please Note: The information shared is intended solely for informational purposes and does not make any investment recommendations.
HDFC SKY from HDFC Securities, one of most trusted trading platforms in India, has been recognized with the *Next-Gen Digi Content Awards 2025-26.
 Join Us
 Add as preferred source on Google


More International News





Open Free Demat Account
Open Free Demat Account










Invest Anytime, Anywhere


By signing up I certify terms, conditions & privacy policy