Russia-Ukraine vs US-Iran War: A Tale of Two Oil Shocks and Divergent Recovery Paths
By HDFC SKY | Last Modified: Jun 18, 2026 03:00 PM IST
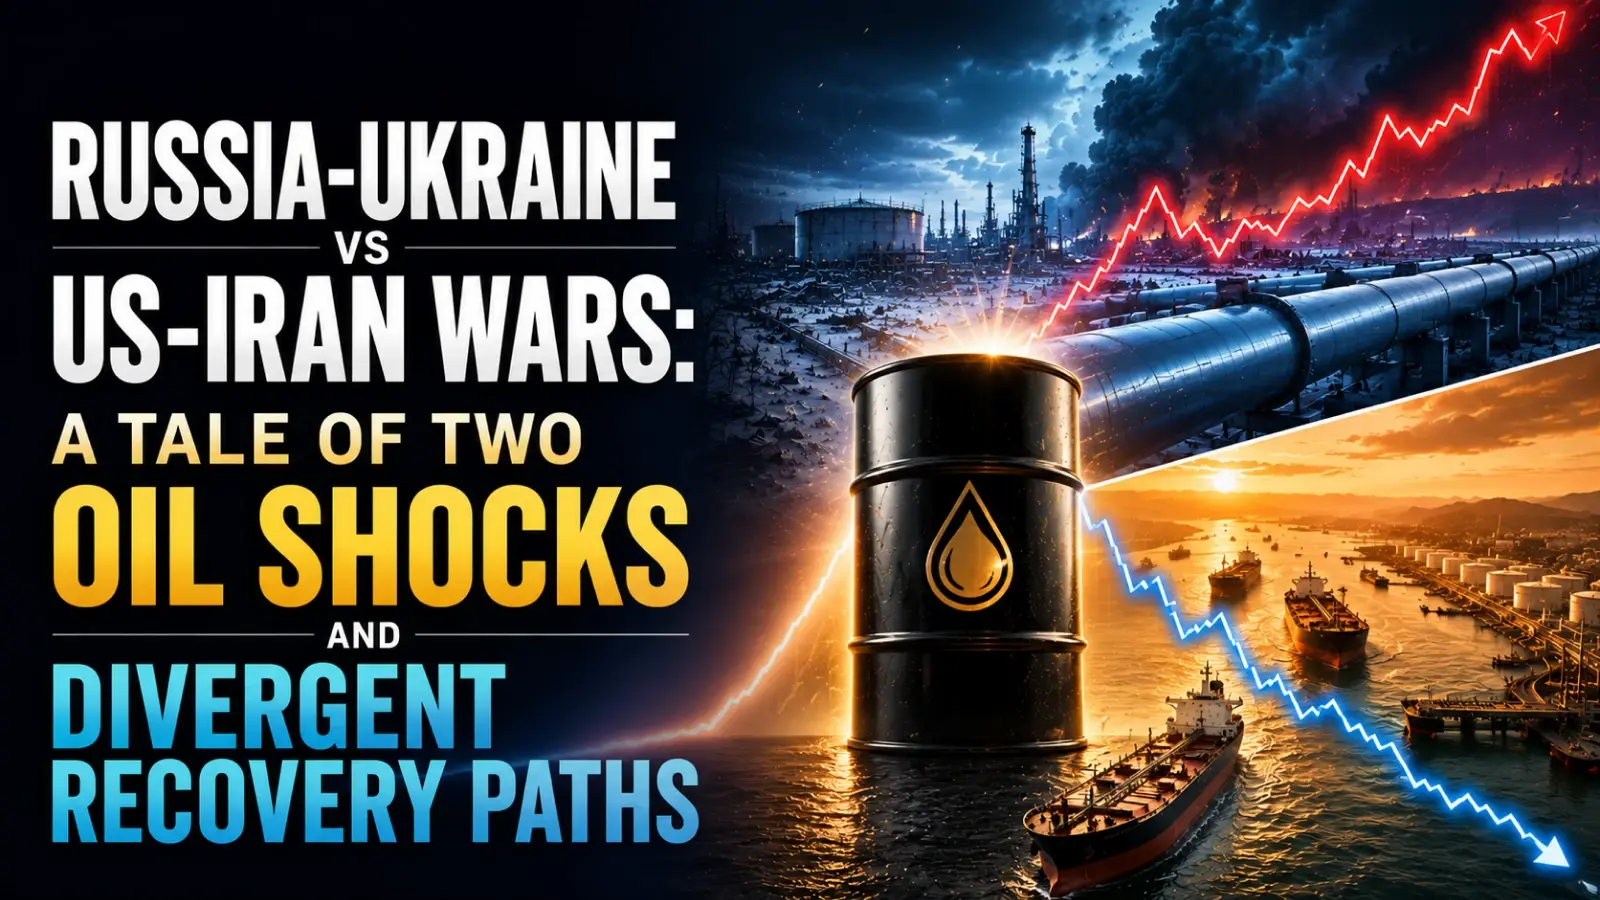
Mumbai, June 18: The global crude oil market has experienced two of the most severe geopolitical shocks to its supply chain in modern history, all within the span of just four years. The Russia-Ukraine war, which started on February 24, 2022, and the US-Israel-Iran war, which erupted on February 28, 2026, each tested the energy market’s resilience in fundamentally different ways.
While the Russia-Ukraine conflict caused a seismic spike in prices from $68 per barrel to $139 per barrel, reflecting a rise of 104%, the Iran conflict caused even more disruption in physical supply since it is estimated that 14 to 15 million barrels per day of crude are currently trapped behind the Strait of Hormuz that was shut down.
However, the price recovery from the Iran conflict has been faster in certain phases than the Russia-Ukraine conflict, despite the underlying refined products market being in crisis mode, despite the fact that both conflicts caused similarly large spikes in crude oil prices.
The Russia-Ukraine War: From $68 to $139 within Two Weeks as Russian Supply Fears Gripped Markets
In the months preceding Russia’s invasion of Ukraine, prices for crude oil had already been rising due to a recovery in demand after the pandemic. In December 2021, the price of Brent crude oil stood at $68 per barrel. However, in January 2022, the price of Brent crude oil rose to around $78 per barrel. In February 2022, just before the invasion of Ukraine, the price of Brent was trading between $80 and $91 per barrel. The average price of Brent crude oil in 2021 was $70.86 per barrel.
The Russian invasion on 24 February 2022 triggered one of the most dramatic increases in oil prices in modern history. Within the first two weeks following the invasion, Brent oil prices shot up by nearly 30%.
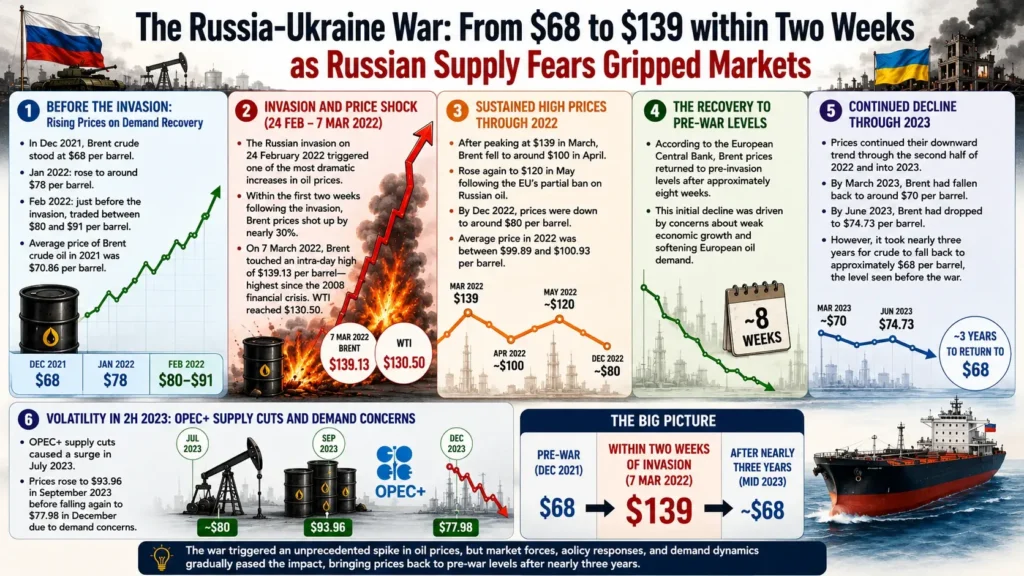
On 7 March 2022, Brent Crude Oil touched an intra-day high of $139.13 per barrel, which was its highest since the 2008 financial crisis, while WTI touched a high of $130.50. On average, the price in 2022 stood between $99.89 and $100.93 per barrel.
Following the spike, prices were sustained at elevated levels throughout much of 2022. Having risen to $139 in March, Brent retreated to around $100 in April before rising again to $120 in May following the European Union’s partial ban on Russian oil. By December 2022, prices were down to around $80 per barrel. The average price in 2023 was $82.17 per barrel.
The recovery to pre-war price levels occurred in distinct phases. According to the European Central Bank, Brent prices returned to their pre-invasion levels after approximately eight weeks. This initial decline was driven by concerns about weak economic growth and softening European oil demand.
Prices continued their downward trend through the second half of 2022 and into 2023. By March 2023, Brent had fallen back to around $70 per barrel. By June 2023, Brent had dropped to $74.73 per barrel. However, it took nearly three years for crude to fall back to approximately $68 per barrel, the level seen before the war.
OPEC+ supply cuts caused a surge in July 2023, with prices increasing to $93.96 per barrel in September 2023 before falling again to $77.98 in December due to demand concerns.
Iran War: From $71 to $138 as Hormuz Closure Created Largest Supply Disruption in History
The Iran war began on 28 February 2026 with coordinated US-Israeli strikes on Iranian military, government, and nuclear sites. On 27 February, the day before the war began, Brent crude closed at $72.48 per barrel and WTI closed at $67.02. By the time trading resumed on Monday, 2 March, Brent had jumped 8% to $77.24.
The opening weeks of the war were catastrophic for energy markets. Iran moved quickly to disrupt shipping in the Gulf, attacking tankers and energy facilities across the region. By 11 March, Brent had reached around $91 per barrel, already 27% higher than the pre-war price. By 15 March, it was at $103.90, a 43% increase.
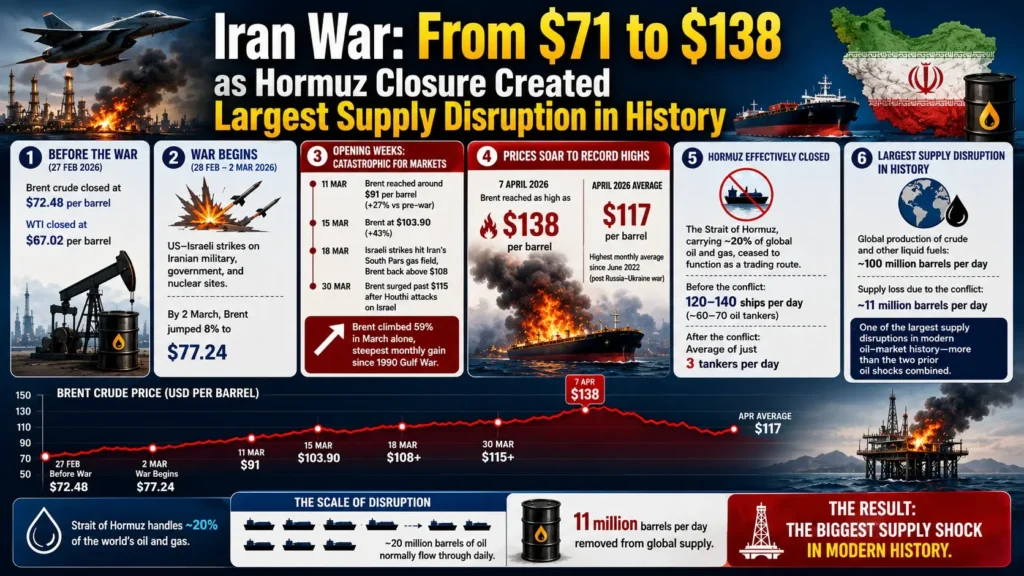
On 18 March, Israeli strikes hit Iran’s South Pars gas field, sending Brent back above $108. By 30 March, Brent had surged past $115 after Houthi forces launched their first attacks on Israel. Brent climbed 59% in March alone, its steepest monthly gain since the 1990 Gulf War.
Brent reached as high as $138 per barrel on 7 April, averaging $117 for the month as a whole, the highest monthly average since June 2022 following Russia’s invasion of Ukraine. The Strait of Hormuz, through which roughly one-fifth of the world’s oil and gas normally flows, had effectively ceased to function as a trading route.
Prior to the conflict, between 120 and 140 ships travelled through the strait each day, about half of them oil tankers carrying some 20 million barrels of oil between them. After the conflict began, the Strait saw an average of just three tankers a day cross.
Measured against global production of crude and other liquid fuels of around 100 million barrels per day, this ranks as one of the largest supply disruptions in modern oil-market history, with the conflict having taken 11 million barrels per day out of global supply — more than the two prior oil shocks combined.
Comparing Price Peaks and Recovery Timelines: Ukraine’s 8-Week Retreat Versus Iran’s 12-Day Plunge
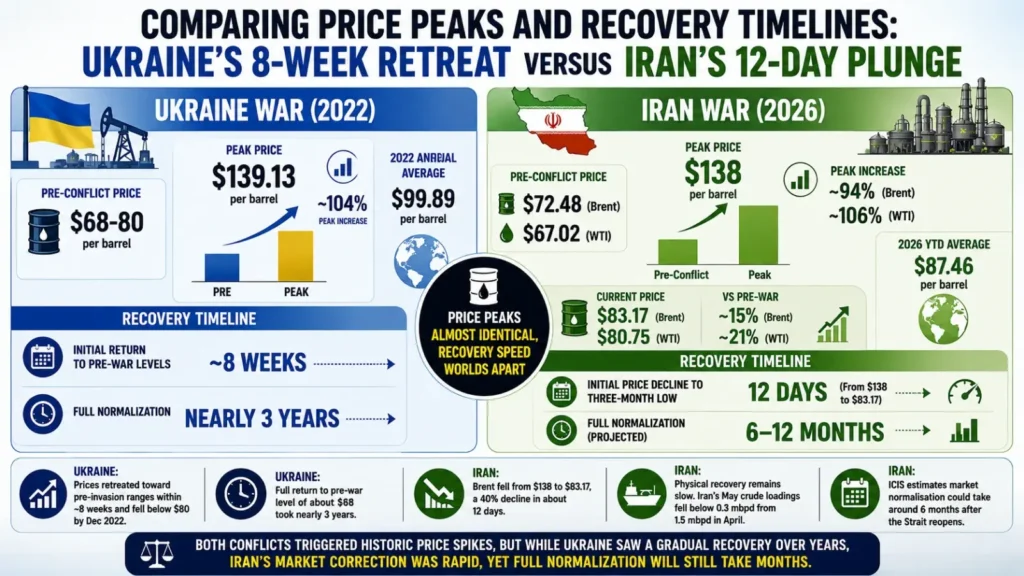
The starkest difference between the two conflicts lies not in the magnitude of the price spike, but in the recovery timeline.
Ukraine War (2022):
- Pre-conflict price: $68-80 per barrel
- Peak price: $139.13 per barrel
- Peak increase: ~104%
- 2022 annual average: $99.89 per barrel
- Initial return to pre-war levels: ~8 weeks
- Full normalization: Nearly 3 years
Iran War (2026):
- Pre-conflict price: $72.48 per barrel (Brent), $67.02 per barrel (WTI)
- Peak price: $138 per barrel
- Peak increase: 94% (Brent), 106% (WTI)
- Current price: $83.17 per barrel (Brent), $80.75 per barrel (WTI)
- Current price vs pre-war: Brent up ~15%, WTI up 21%
- 2026 YTD average: $87.46 per barrel
- Initial price decline to three-month low: 12 days (from $138 to $83.17)
- Full normalization: Projected 6-12 months
During the Ukraine war, Brent retreated toward pre-invasion trading ranges within roughly eight weeks and fell below $80 by December 2022, although a full return to the pre-war level of about $68 took nearly three years. The Iran war saw a much sharper correction, although prices remain above pre-war levels and physical market normalisation has yet to occur. Following the 8 April US-Iran ceasefire, Brent plunged nearly 16% below $100 and fell 19% in May to $92.56 on 29 May. After President Trump’s 16 June peace announcement, Brent dropped to $83.17 and WTI to $80.75.
Brent’s fall from $138 to $83.17 marked a 40% decline in about 12 days. Yet physical recovery remains slow: Iran’s May crude loadings fell below 0.3 mbpd from 1.5 mbpd in April, and ICIS estimates market normalisation could take around six months after the Strait reopens.
Nature of Disruption: Trade Redirection Versus Physical Quantity Shock
The Ukraine war was primarily a trade redirection event. Russian crude was diverted to new buyers in Asia and Turkey, often at significant discounts to bypass Western sanctions. The actual production reduction was smaller than initially feared. Russian Urals crude traded at a massive discount to Brent, reaching a maximum of $31.9 per barrel in the second quarter of 2022 and $30 in the first quarter of 2023.
The Iran war, by contrast, is a physical quantity shock. The Strait of Hormuz blockade has physically trapped an estimated 14 to 15 million barrels per day of crude — roughly five times the peak disruption of the Ukraine crisis.
Several analysts have characterised the Ukraine conflict primarily as a trade-redirection event, whereas the Iran conflict involved a direct loss of transport capacity and physical supply availability. The conflict has disrupted more than 14 million barrels per day, equivalent to about 14% of global demand.
Combined crude production from Iran, Iraq, Kuwait, Saudi Arabia, UAE, and Bahrain declined from around 23.7 million barrels per day in February to 13.5 million barrels per day by May, implying an average loss of roughly 10.3 million barrels per day at the peak of disruption.
Strategic Petroleum Reserves: 2022’s 182 Million Barrels Versus 2026’s Record 400 Million Release
Strategic Petroleum Reserve (SPR) releases played a crucial role in both crises, though the scale of intervention differed sharply. During the Ukraine war in 2022, the International Energy Agency (IEA) coordinated the release of approximately 182 million barrels from member nations’ reserves, then the largest release in its history. During the Iran war, the response was far larger.
On 11 March 2026, the IEA approved a record 400 million-barrel release from emergency stockpiles, more than double the 2022 volume, while the US separately announced a 172 million-barrel SPR release. At the time, IEA members held over 1.2 billion barrels of public emergency stocks and another 600 million barrels in industry inventories. By 12 June, 252 million barrels had already been released.
However, these reserves are not unlimited. The 400 million barrels equal only about 20 days of Hormuz supply. OECD inventories fell to their lowest level since 1990, total drawdowns reached 163 million barrels, and the US SPR dropped to 340.3 million barrels, its lowest level since 1983.
Refined Products Crisis: Where 2026 Bites Harder Than 2022
A key area where the Iran war surpassed the Ukraine conflict was refined fuels. The Strait of Hormuz carries 5-6 million barrels per day (mbpd) of gasoline, diesel, and jet fuel, accounting for about 19% of global seaborne fuel trade, with no viable alternative route. Around 80% of the 14-15 mbpd of Gulf crude passing through the Strait normally supplies Asian refineries. Disruptions forced Sinopec to cut throughput by over 10%, while China’s teapot refiners lost access to nearly 1.4 mbpd of Iranian crude.
ExxonMobil’s Jurong Island refinery fell to 50% utilisation, Singapore Refining Co to 60%, and Wood Mackenzie estimates Asian run cuts of 4-5 mbpd. Combined with lost fuel exports, the supply shortfall reached 9-11 mbpd, pushing refined fuel prices well above 2022 levels despite lower crude prices.
OPEC+ Policy Divergence: Defending the Floor Versus Absorbing the Shock
During the Ukraine war, OPEC+ largely stuck to its gradual output increases, refusing to aggressively pump more to offset Russian losses. However, in October 2022, OPEC+ enacted deep production cuts, slashing output quotas by 2 million barrels per day starting from November, effective through the end of 2023. This was followed by a 1.66 million barrel per day curtailment announced in April 2023 and a unilateral cut by Saudi Arabia of 1 million barrels per day from July. Adjusting for capacity distortions, the 19 OPEC+ members subject to quotas agreed to remove around 3.7 million barrels per day.
During the Iran war in 2026, OPEC+ agreed to a larger-than-expected production increase over the same weekend as the IEA’s reserve release — a move that would normally push prices lower. However, as analysts described it, this was potentially “an entirely moot point” because the Hormuz closure makes it impossible to move much of that additional supply to market. The cartel’s policy response was effectively neutralised by the physical blockade.
Alternative Supply Routes: Petroline and ADCOP Step In
While the Strait remained largely closed, alternative supply routes provided partial relief. Saudi Arabia ramped up its Petroline (East-West Pipeline), built in the 1980s during the Iran-Iraq war as a strategic contingency, from 3 million barrels per day to its 7 million barrel emergency ceiling, generating approximately 4 million barrels per day of incremental exports.
The pipeline takes supplies from Abqaiq to the Red Sea coast Yanbu terminal. The UAE’s Abu Dhabi Crude Oil Pipeline (ADCOP) lifted an estimated 0.4 million barrels per day above pre-war throughput.
Demand-Side Divergence: Post-COVID Boom vs Sluggish Growth
The demand backdrop behind the two oil shocks could not have been more different. The 2022 rally was fuelled by a powerful post-COVID recovery colliding with supply fears. As economies reopened and travel resumed, global oil demand surged. The International Energy Agency (IEA) projected global oil demand growth of 2.4 million barrels per day (mbpd) in 2023.
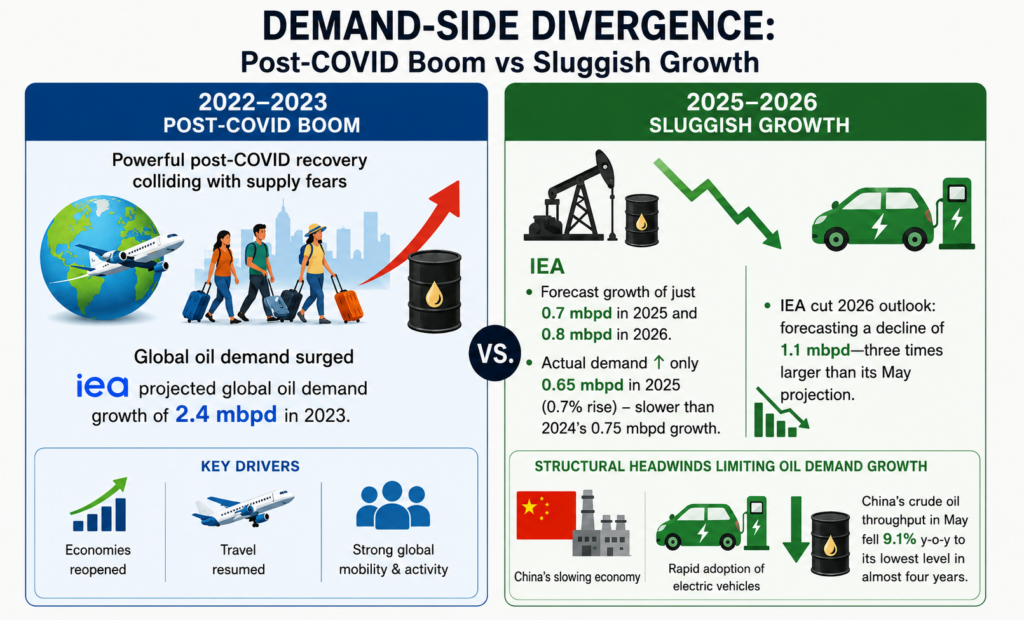
By 2025-2026, however, demand growth had slowed dramatically. The IEA forecast growth of just 0.7 mbpd in 2025 and 0.8 mbpd in 2026. Actual demand increased by only 0.65 mbpd in 2025, a 0.7% rise and a further slowdown from 2024’s 0.75 mbpd growth. The agency later cut its 2026 outlook, forecasting a decline of 1.1 mbpd—three times larger than its May projection.
While the IEA expects demand growth to rebound to 2 mbpd in 2027, China’s slowing economy and the rapid adoption of electric vehicles have structurally limited oil demand growth. China’s crude oil throughput in May fell 9.1% year-on-year to its lowest level in almost four years.
Futures Markets Signal Immediate Supply Fears
The structure of oil futures markets highlights how traders viewed each crisis. While backwardation emerged during the Ukraine war, it remained relatively contained.
During the Iran conflict, extreme backwardation developed as the Brent six-month spread widened sharply. This reflected market fears of immediate supply disruptions rather than longer-term structural shortages.
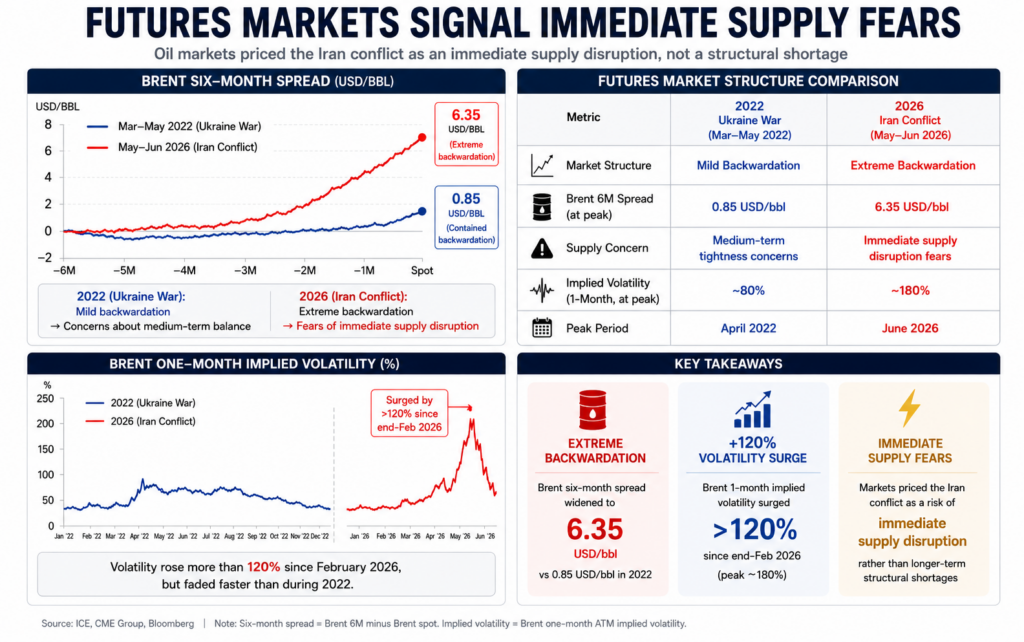
Brent’s one-month implied volatility surged by more than 120% since the end of February 2026. Despite the sharp increase, volatility faded more quickly than in 2022, suggesting investors had become more efficient at pricing geopolitical risks.
The Ukraine war triggered a 104% price spike with an eight-week initial recovery and three-year full normalisation, while the Iran war produced a larger physical supply shock yet saw prices return to near $83 within 12 days, though refined products remain severely strained. Strategic reserves provide a temporary buffer, with OECD stocks at 35-year lows and replenishment posing medium-term challenges.
Source
- https://ppac.gov.in/prices/international-prices-of-crude-oil
Disclaimer
If you have any concerns, questions, or wish to point out any discrepancies in our content, please feel free to write to us at content@hdfcsec.com.
Please Note: The information shared is intended solely for informational purposes and does not make any investment recommendations