Nifty 50
- HDFC Bank₹824.0523.00 (2.87%)
- Kotak Mahindra Bank₹383.25-13.50 (-3.40%)
- Bajaj Auto₹10,018.50233.00 (2.38%)
- TCS₹2,059.80-33.70 (-1.61%)
- Hindalco Industries₹973.3520.15 (2.11%)
- Infosys₹1,034.40-12.80 (-1.22%)
- Mahindra & Mahindra₹3,197.9061.00 (1.94%)
- Wipro₹174-2.08 (-1.18%)
- Eicher Motors₹7,481.50142.00 (1.93%)
- Dr. Reddy's Labs₹1,359.10-15.00 (-1.09%)
- Bharat Electronics₹424.706.65 (1.59%)
- Tech Mahindra₹1,396-14.10 (-1.00%)
- Reliance Industries₹1,32016.00 (1.23%)
- Power Grid Corp₹285.20-2.65 (-0.92%)
- ONGC₹240.662.82 (1.19%)
- Bajaj Finserv₹1,880-15.60 (-0.82%)
- ICICI Bank₹1,427.1015.70 (1.11%)
- ITC₹288.50-1.45 (-0.50%)
- JSW Steel₹1,240.6010.40 (0.85%)
- HCL Technologies₹1,133.80-5.20 (-0.46%)
- Offerings
- Tools & Platforms
Tools & Calculators
- Open API
- Calculators
- SIP Calculator
- CAGR Calculator
- Compound Interest Calculator
- FD Calculator
- RD Calculator
- EPF Calculator
- Retirement Calculator
- HDFC SIP Calculator
- Mutual Fund Return Calculator
- Lumpsum Calculator
- Step Up SIP Calculator
- ETF SIP Calculator
- Brokerage Calculator
- Equity Margin Calculator
- SWP Calculator
- EMI Calculator
- MTF Calculator
- Margin Pledge Calculator
- Markets
Stocks
F&O
Mutual Funds
- More
Exchange Traded Funds (ETFs): Invest in ETF’s with HDFC Sky
Elevate your trading & investment with our tailored ETF trading solutions
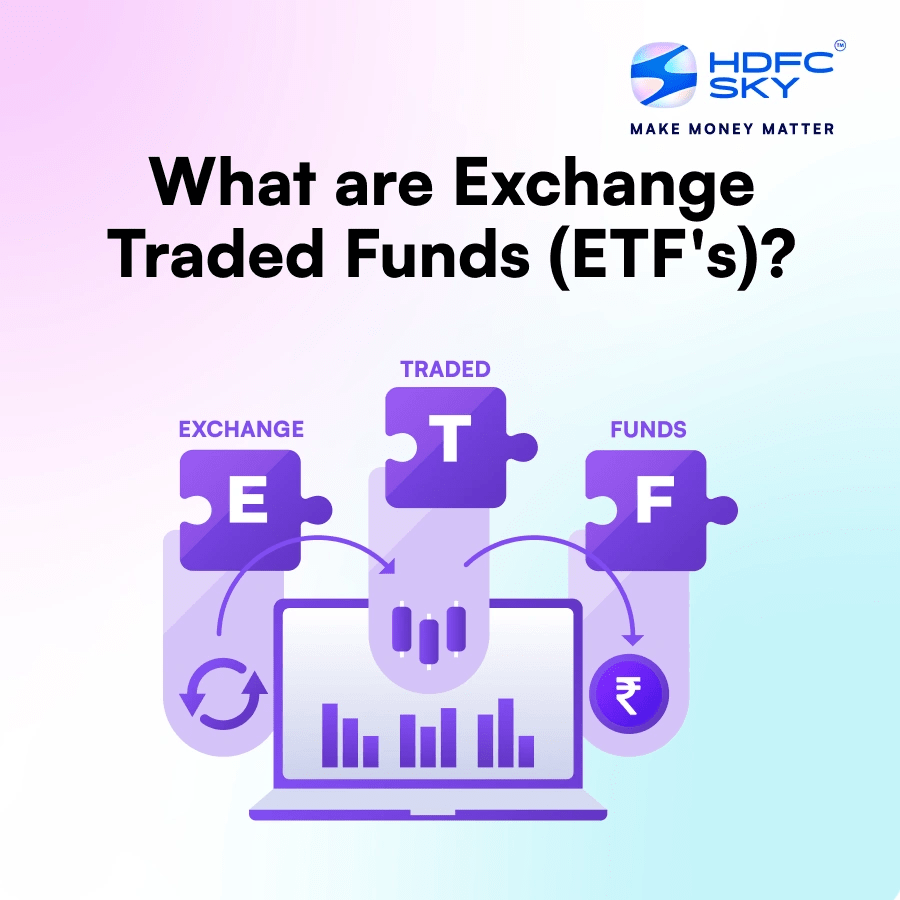
What are Exchange Traded Funds (ETFs)?
ETFs are investment funds traded on stock exchanges with a diversified portfolio of stocks, bonds, commodities and other securities. The investors get access to a highly diversified exchange-listed investment tool with lower costs and flexibility of individual stocks. Usually, the composition of an ETF reflects the composition of an index or underlying securities.
 Index ETFs
- Sectoral ETFs
- Commodity ETFs
- Bond ETFs
- Global ETFs
Benefits of Investing in Exchange Traded Funds (ETF's) with HDFC Sky
Diversification of Portfolio
Liquidity of Buying and Selling
Relatively Lower Costs
ETF is a basket that consists of a universe of assets
Buy and sell ETFs like stocks throughout the day
Holdings of ETFs are mostly disclosed daily
Access to global investment beyond the local markets
Get benefits of mutual fund plus equities with ETF
How Does ETFs Work at HDFC Sky?
Open Your Demat Account with HDFC Sky
Add Funds to your HDFC Sky Account
Select Stock from Research Recommendation
Place Your Buy/Sell Order on Web or App
Order Executed
Settlement (T+1) Day
Open Your Demat Account with HDFC Sky
Add Funds to your HDFC Sky Account
Select Stock from Research Recommendation
Place Your Buy/Sell Order on Web or App
Order Executed
Settlement (T+1) Day
Delivery Order
₹20 Brokerage
Intraday Order
₹20 Brokerage
Benefits of Investing in Exchange Traded Fund (ETFs)
Diversification
ETFs provide exposure to a wide range of assets
Lower Cost
ETFs usually have lower transaction costs
Liquidity
ETFs can be bought and sold like stocks, providing flexibility
Transparency of Holdings
Most ETFs are obligated to disclose their holdings on a daily basis
Tax Efficiency
ETFs tend to be more tax-efficient compared to actively managed mutual funds,
Diverse Order Options
ETFs are traded similarly to stocks.
What is ETF in Stock Market?
Exchange Traded Funds (ETFs) are similar to index funds but are listed and traded on exchanges just like stocks. Before ETFs were developed, this level of accessibility was not possible. Globally, ETFs have opened up new investment avenues for both retail investors and institutional money managers. They allow investors to gain broad access to entire stock markets in different countries and specific sectors with relative simplicity, real-time trading capabilities, and typically lower costs than many other investment options. An ETF consists of a portfolio of stocks that mirrors an index, such as the S&P CNX Nifty or BSE Sensex. Its trading value depends on the net asset value of the underlying stocks it represents. Think of an ETF as a type of mutual fund that you can buy or sell in real-time, with prices fluctuating throughout the trading day.
How Do ETFs Work?
Exchange-traded funds (ETFs) operate in this way: the fund provider owns a set of underlying assets, creates a fund designed to mirror their performance, and then offers shares of this fund to investors. Although shareholders hold a portion of the ETF, they do not directly own the assets within it. However, investors in an ETF that follows a stock index might still receive dividend payouts from dividend-paying stocks within that index. ETFs are structured to follow the value of an underlying asset or index such as gold or a stock index like the Nifty 50 but they trade at prices determined by the market, which may differ from the actual asset. Additionally, due to factors like management fees, the long-term returns of an ETF may not perfectly match the returns of the asset it tracks.
Here’s a simplified overview of how ETFs work:
- An ETF provider selects assets from various classes, such as stocks, bonds, commodities, or currencies, and creates a basket with a unique ticker symbol.
- Investors purchase shares in this basket through their brokerage accounts, similar to buying company stock.
- Throughout the trading day, buyers and sellers trade the ETF on an exchange, just like a stock.
Types of Index Funds ETF
An Index ETF is a type of passive mutual fund that lets investors buy a collection of securities in a single transaction. The main goal is to mirror the performance of a specific stock market index, like the Nifty 50. By purchasing units of an index fund or ETF, investors acquire a stake in a portfolio that holds the same securities as the underlying index.
- Gold ETF Gold ETFs are investment tools tied to gold prices or invested in gold bullion, designed to follow the performance of gold in the market. The value of these funds moves with the price of gold – as gold prices increase, so does the ETF’s value, and vice versa. In India, many top financial institutions manage Gold ETFs. Popular banks like HDFC offer these funds as a way to invest in gold without holding physical assets.
- Bond ETF Similar to bond mutual funds, bond ETFs represent a portfolio of bonds that trade on an exchange like stocks, often with passive management. Examples of bond ETFs in India include HDFC Corporate Bond ETF, which provides exposure to a diversified portfolio of corporate bonds, and HDFC Gilt ETF, which focuses on government securities.
- Sector ETF: Sector ETFs invest exclusively in securities within a specific industry or sector. Examples include funds focused on pharmaceuticals, technology, and other defined industries. The Nifty CPSE ETF is one of the key examples, providing exposure specifically to Central Public Sector Enterprises (CPSEs) listed on the Nifty CPSE Index. This ETF allows investors to gain a stake in a diversified portfolio of government-owned companies, making it an attractive option for those interested in India’s public sector growth.
- Currency ETF Currency ETFs offer investors access to currency markets without the need to buy individual currencies directly. These funds can invest in a single currency or a mix of multiple currencies, with the objective of tracking their price movements. Currency ETFs allow investors to benefit from fluctuations in currency values or a basket of selected currencies.
- Global ETF Global ETFs provide an easy medium to invest in international markets, a great way to diversify your portfolio. In global ETFs, funds are pooled from various investors to invest in securities that follow an underlying index or a theme.
The fund manager holds the securities in the same proportions and makes necessary adjustments to the holdings so as to reflect changes in the index or theme, therefore closely matching the performance of the index or the theme. Global ETFs allow you to diversify your investment opportunities by taking it beyond the local market, to worldwide. The good part of global ETFs is that they are cost-effective as they come with lower fees in comparison to actively managed funds, thus allowing you to keep a greater share of your gains. These funds provide smooth liquidity, making it simple to buy and sell throughout business hours. Since Global ETFs usually follow well-known international indexes, transparency is advantageous since it gives investors a clear picture of their holdings to help them make well-informed decisions. By exposing your portfolio to a variety of currencies and lowering reliance on the performance of a single one, they can also assist in reducing currency risk. In conclusion, Global ETF funds offer a practical and economical means of managing and diversifying your investments globally.
Benefits of Investing in ETFs
- Flexibility in Trading: Unlike traditional mutual funds, which are only traded at the end of the trading day, ETFs allow investors to buy and sell shares at any time during market hours.
- Transparency of Holdings: Most ETFs are obligated to disclose their holdings on a daily basis, providing investors with greater transparency regarding their investments.
- Tax Efficiency: ETFs tend to be more tax-efficient compared to actively managed mutual funds, as they typically generate fewer capital gain distributions, which can benefit investors.
- Diverse Order Options: ETFs are traded similarly to stocks. Investors can utilise various order types, such as limit orders and stop-loss orders, which are not available for mutual funds.
- Ease of Diversification: ETFs make it easy to diversify your portfolio. By buying one ETF, you gain exposure to a collection of securities. This spreads your risk across different assets and sectors.
- Liquidity: ETFs are known for their high liquidity. They are traded actively during market hours. High liquidity can lead to narrower bid-ask spreads. This may reduce transaction costs for investors.
- Potential for Dividend Income: Many ETFs pay dividends from the assets they hold. This can provide an added income stream. It is ideal for investors who seek income-generating options.
- Simplified Management: ETFs are passively managed. They typically follow an index and require less monitoring. It can simplify investment management.
Why Invest in ETFs?
ETFs, or Exchange-Traded Funds, offer many benefits for investors. They let you invest in a collection of stocks, bonds, or other assets through one fund. This makes it easier to diversify your portfolio. Instead of buying individual stocks, you get access to multiple assets at once. This reduces risk and spreads your investment. ETFs are also more affordable. Their expense ratios are often lower than those of mutual funds. This means you pay less in fees over time. Plus, ETFs trade like stocks on the exchange. You can buy or sell them anytime during stock market hours, which adds flexibility. Overall, ETFs provide a simple way to start investing. They fit a wide range of goals, from short-term trading to long-term growth. For new and seasoned investors alike, ETFs Investment offer a balance of risk and reward, making them a smart choice.
How to Invest in ETF?
Start by opening Demat Account and exploring ETFs that match your financial goals, risk tolerance, and ETF investment objectives. Look into the ETF’s underlying assets, expense ratio, past performance, and liquidity. This will help ensure that the ETF aligns with your investment strategy.
- Step 1: Log in to Your Trading Platform: Access your demat account through the HDFC Sky trading platform or any other preferred platform. Make sure your demat account is linked to your trading account to allow for smooth transactions.
- Step 2: Place Your Order: After selecting the ETFs you want to invest in, log in to your platform and go to the order placement section. Enter the ETF’s ticker symbol or name in the order form to initiate the buying process.
- Step 3: Choose Quantity and Set Price: Decide the number of ETF units you want to purchase and set your preferred price if you’re using a limit order. Double-check the details for accuracy before submitting.
- Step 4: Confirm and Submit Order: Review your order summary carefully, verifying details such as the ETF name, quantity, price, and total investment. Once satisfied, submit the order to confirm your purchase.
- Step 5: Monitor Your ETF Investment: After purchasing, monitor your ETF’s performance through the trading platform. Stay updated with price movements and market news that could influence your investment.
Conclusion
Before you invest in an ETF, it’s important to review both its summary prospectus and the full prospectus. These documents provide comprehensive details about the ETF’s investment goals, primary strategies, risks, costs, and historical performance. You can find prospectuses on the websites of the financial firms that manage the ETF, as well as through your broker. Never invest in something you do not fully understand. If you cannot describe the investment opportunity clearly and concisely, it might be wise to reassess that investment. Lastly, consider consulting an investment professional for guidance. If you do, make sure they understand your investment goals and risk tolerance. A good advisor should be able to explain how a complex product aligns with your objectives.
Learn More About Exchange Traded Fund (ETFs)


FAQ's On Exchange Traded Fund
How to buy an ETF?
To buy an ETF, you need a demat and trading account with a brokerage. Start by researching the type of ETF you want to invest in, considering factors like expense ratios, historical performance, and the assets it tracks. Log in to your brokerage’s trading platform, find the specific ETF using its ticker symbol, and place an order. Enter the quantity you wish to purchase, and set a price if using a limit order. Once you confirm, the transaction will go through, and the ETF units will be added to your demat account. You can monitor your investment through your platform.
Can we invest in an ETF without a demat account?
No, investing in an ETF without a demat account is not possible in India. A demat account is needed to hold ETF units electronically. Since ETFs are traded on stock exchanges like shares, they require a demat account for buying, holding, and selling units. The demat account provides a secure digital space to store these units. Without it, you cannot complete ETF transactions or track your holdings. So, to invest in ETFs, it’s essential to open a demat account and link it with your trading account for smooth, hassle-free trading.
When is the ETF NAV calculated?
The Net Asset Value (NAV) of an ETF is calculated at the end of each trading day. NAV is based on the value of the underlying assets within the ETF, minus any liabilities. Although ETF shares trade throughout the day at prices influenced by supply and demand, the NAV gives investors an idea of the ETF’s actual value. This end-of-day calculation provides a reference for investors, but prices fluctuate during trading hours. The NAV reflects only the closing market value, while real-time prices may vary depending on current market conditions.
What is the difference between ETF and F&O?
ETFs and Futures & Options (F&O) are different investment instruments. ETFs are funds that hold a basket of assets like stocks or bonds, allowing investors to gain exposure to entire indexes or sectors with a single purchase. They trade on exchanges like shares, offering easy entry and exit. Futures & Options (F&O), on the other hand, are derivative contracts allowing buyers or sellers to trade an asset at a future date and set price. F&O are generally higher risk, suitable for experienced investors, while ETFs are considered lower-risk, passive investments ideal for diversification.
What is an ETF Fund?
An ETF, or Exchange-Traded Fund, is an investment fund that tracks a specific index, commodity, sector, or other assets.The ETF meaning combines the diversification benefits of mutual funds with the trading flexibility of stocks. They hold a basket of assets, making it easy to gain exposure to different segments of the market with a single investment. ETFs trade on stock exchanges, allowing investors to buy or sell them like stocks during trading hours. ETFs generally have lower fees than mutual funds and are an effective way to build a diversified portfolio without individual stock selection.


By signing up I certify terms, conditions & privacy policy