Nifty 50
- ICICI Bank₹1,56565.00 (4.33%)
- Power Grid Corp₹258.10-3.05 (-1.17%)
- Mahindra & Mahindra₹3,259.10131.60 (4.21%)
- Eicher Motors₹7,644.50-68.50 (-0.89%)
- HDFC Life Insurance ₹562.5518.75 (3.45%)
- Shriram Finance₹957.55-6.45 (-0.67%)
- Titan Company₹4,995.20160.60 (3.32%)
- Tata Motors PV₹291.75-1.95 (-0.66%)
- HDFC Bank₹784.6524.65 (3.24%)
- Max Healthcare₹929-3.00 (-0.32%)
- Axis Bank₹1,320.8040.80 (3.19%)
- Grasim Industries₹3,221.80-5.80 (-0.18%)
- Adani Ports₹1,939.1054.50 (2.89%)
- JSW Steel₹1,353.20-2.40 (-0.18%)
- Kotak Mahindra Bank₹476.359.35 (2.00%)
- Bharat Electronics₹394.85-0.25 (-0.06%)
- Sun Pharmaceutical₹1,862.6033.60 (1.84%)
- Bharti Airtel₹2,093.6036.70 (1.78%)

- Offerings
- Tools & Platforms
Tools & Calculators
- Open API
- Calculators
- SIP Calculator
- CAGR Calculator
- Compound Interest Calculator
- FD Calculator
- RD Calculator
- EPF Calculator
- Retirement Calculator
- HDFC SIP Calculator
- Mutual Fund Return Calculator
- Lumpsum Calculator
- Step Up SIP Calculator
- ETF SIP Calculator
- Brokerage Calculator
- Equity Margin Calculator
- SWP Calculator
- EMI Calculator
- MTF Calculator
- Margin Pledge Calculator
- Algo Strategy
- Markets
Stocks
F&O
Mutual Funds
- More
EAAA India Alternatives IPO
₹14,985/9 shares
Minimum Investment
IPO Details
26 Oct 26
28 Oct 26
₹14,985
9
₹1,585 to ₹1,665
NSE, BSE
₹1,200 Cr
02 Nov 26
Open Free Demat Account
EAAA India Alternatives IPO Timeline
Bidding Start
26 Oct 26
Bidding Ends
28 Oct 26
Allotment Finalisation
29 Oct 26
Refund Initiation
30 Oct 26
Demat Transfer
30 Oct 26
Listing
02 Nov 26
About EAAA India Alternatives Limited
EAAA India Alternatives Limited (formerly Edelweiss Alternative Asset Advisors Limited) is an alternative investment management platform focused on India’s real assets and private credit markets. Incorporated in 2008, it manages funds for domestic and global institutional investors, HNIs, UHNIs, and family offices through two core verticals-Real Assets and Private Credit-supplemented by portfolio management services. As of June 30, 2026, it managed AUM of ₹9,53,448.78 million and FPAUM of ₹4,86,231.76 million across 10 Real Assets funds (including two InvITs) and 16 Private Credit funds. The platform is supported by its wholly owned subsidiary Sekura India Management Limited, which provides on-ground asset operating and management capabilities. It employed 277 people as of June 30, 2026.
EAAA India Alternatives Limited IPO Overview
EAAA India Alternatives Limited is launching a book-built IPO of ₹12,000 million, structured entirely as an Offer for Sale of 72,07,207 equity shares of face value ₹5 each. The issue opens on October 26, 2026, and closes on October 28, 2026, with allotment expected on October 29, 2026, and listing tentatively on November 2, 2026, on BSE and NSE. The price band is ₹1,585-₹1,665 per share, and the lot size is 9 shares, requiring a minimum retail investment of ₹14,985 at the upper band. Axis Capital Ltd. is the book running lead manager, and MUFG Intime India Pvt. Ltd. is the registrar. Because the issue is entirely an OFS, the company will not receive any proceeds; all proceeds will go to the selling shareholders. Pre- and post-issue shareholding remains at 6,46,55,246 shares, reflecting no fresh issuance or dilution. Market capitalisation at the upper price band stands at approximately ₹1,07,651 million.
EAAA India Alternatives Limited Upcoming IPO Details
| Category | Details |
| Issue Type | Book Built Issue IPO |
| Total Issue Size | 72,07,207 shares (aggregating up to ₹12,000 million) |
| Fresh Issue | Nil |
| Offer for Sale (OFS) | 72,07,207 shares of ₹5 (aggregating up to ₹12,000 million) |
| IPO Dates | October 26-28, 2026 |
| Price Bands | ₹1,585-₹1,665 per share |
| Lot Size | 9 shares |
| Face Value | ₹5 per share |
| Listing Exchange | BSE, NSE |
| Shareholding pre-issue | 6,46,55,246 shares |
| Shareholding post-issue | 6,46,55,246 shares |
EAAA India Alternatives Limited IPO Lots
| Application | Lots | Shares | Amount (₹) |
| Retail (Min) | 1 | 9 | 14,985 |
| Retail (Max) | 13 | 117 | 1,94,805 |
| S-HNI (Min) | 14 | 126 | 2,09,790 |
| S-HNI (Max) | 66 | 594 | 9,89,010 |
| B-HNI (Min) | 67 | 603 | 10,03,995 |
EAAA India Alternatives Limited IPO Reservation
| Investor Category | Shares Offered |
| QIB Shares Offered | Not more than 50% of the Net Offer |
| Retail Shares Offered | Not less than 35% of the Net Offer |
| NII (HNI) Shares Offered | Not less than 15% of the Net Offer |
EAAA India Alternatives Limited IPO Valuation Overview
| KPI | Value |
| Earnings Per Share (EPS) | ₹40.36 |
| Price/Earnings (P/E) Ratio | 41.25x |
| Return on Net Worth (RoNW) | 28.96% |
| Net Asset Value (NAV) per share | ₹163.69 |
| Return on Equity (RoE) | 28.96% |
| Return on Capital Employed (RoCE) | 35.31% |
| EBITDA Margin | 43.56% |
| PAT Margin | 24.01 |
| Debt to Equity Ratio – FY26 | 0.34x |
[Text Wrapping Break]
Objectives of the IPO Proceeds
- Being entirely an Offer for Sale issue, the IPO proceeds will accrue entirely to the selling shareholders. EAAA India Alternatives Limited will not receive any funds from the offering and will not utilise proceeds for corporate purposes.
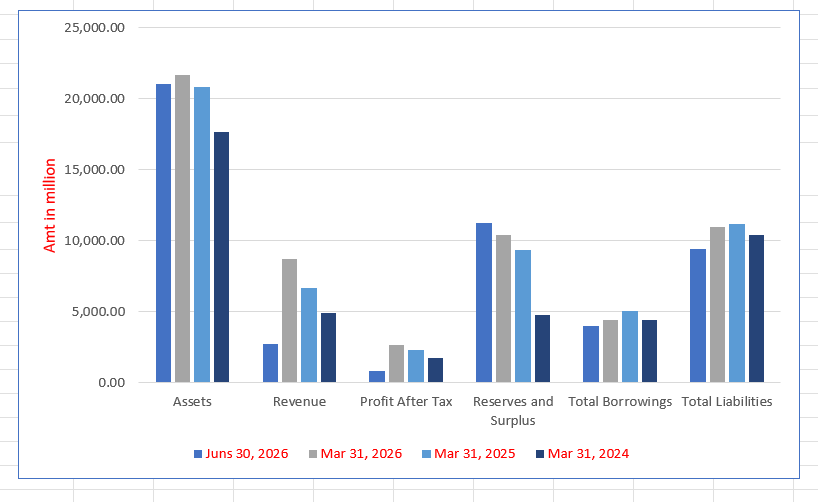
EAAA India Alternatives Limited Financials (₹ in million)
| Particulars | Juns 30, 2026 | Mar 31, 2026 | Mar 31, 2025 | Mar 31, 2024 |
| Assets | 21,018.39 | 21,702.77 | 20,850.71 | 17,696.59 |
| Revenue | 2,755.29 | 8,695.40 | 6,702.59 | 4,925.79 |
| Profit After Tax | 807.06 | 2,651.97 | 2,297.79 | 1,751.60 |
| Reserves and Surplus | 11,282.43 | 10,433.95 | 9,343.11 | 4,806.35 |
| Total Borrowings | 3,991.97 | 4,410.27 | 5,074.90 | 4,448.29 |
| Total Liabilities | 9,414.55 | 10,947.41 | 11,186.19 | 10,401.78 |
Financial Status of EAAA India Alternatives Limited
EAAA India Alternatives Limited IPO Strengths
Established Institutional Platform
EAAA India Alternatives Limited has built an institutional alternative asset management platform over more than 17 years, managing long-term patient capital across market cycles. Its flagship funds are in their third or fourth vintages, reflecting repeat investor confidence. This longevity provides a durable foundation for revenue visibility and positions the company as a differentiated manager in India’s evolving alternatives landscape.
Diversified Investment Verticals
EAAA India Alternatives Limited operates across Real Assets and Private Credit, with sub-verticals spanning infrastructure, commercial real estate, energy transition, performing credit, special situations, and investment-grade credit. This multi-vertical architecture reduces dependence on any single asset class and provides resilience to market fluctuations, while allowing the company to offer yield-oriented solutions across the risk spectrum.
Strong AUM and Fee-Earning Franchise
EAAA India Alternatives Limited manages AUM of ₹9,53,448.78 million and FPAUM of ₹4,86,231.76 million as of June 30, 2026. The FPAUM base underpins management fee revenue and demonstrates the company’s ability to monetise its investment platform. Growth in FPAUM at a three-year CAGR of 23% indicates sustained traction with institutional and private wealth clients.
Proprietary Asset Operating Capability
EAAA India Alternatives Limited differentiates itself through Sekura, its wholly owned asset operating and management subsidiary. Sekura provides on-ground operations, maintenance, monitoring, and efficiency improvement across infrastructure, commercial real estate, and energy assets in more than 10 Indian states, with over 57 operational team members. This hands-on capability supports both investment underwriting and portfolio value creation.
Structural Industry Tailwinds
EAAA India Alternatives Limited operates in a market where Indian alternatives AUM is projected to grow from approximately $152 billion in December 2025 to $276 billion by 2030, with yield and income strategies expected to capture over 50% of the market. India’s alternatives penetration at roughly 3.5% of GDP versus 27.8% in North America underscores the long growth runway available to scaled platforms.
More About EAAA India Alternatives Limited
Business Model
EAAA India Alternatives Limited operates as an alternative investment management platform with two reportable verticals:
I. Real Assets:
Invests in infrastructure, commercial real estate, perpetual capital, and energy transition opportunities through equity, quasi-equity, and debt instruments. The vertical includes 10 active funds, of which two are InvITs.
II Private Credit:
Provides financing across performing credit, special situations, real estate credit, and investment-grade credit through 16 active funds.
The company also offers co-investment opportunities via portfolio management services.
Operational Infrastructure
I. Sekura India Management Limited:
A wholly owned subsidiary providing asset operating and management services, including 24×7 on-ground monitoring, predictive maintenance, ISO-certified processes, and a centralized control room using drones and infrared monitoring.
II. Technology Platform:
In-house deal management, data management, approval automation, and client coverage systems support origination, underwriting, monitoring, and reporting.
Financial Trajectory
Revenue from operations has grown from ₹4,925.79 million in FY24 to ₹8,695.40 million in FY26, while PAT rose from ₹1,751.60 million to ₹2,651.97 million over the same period. The company reported RoNW of 25.97% in FY26 and maintained a debt-to-equity ratio of 0.41x.
Client Franchise
As of September 30, 2025, global institutional clients had committed close to $3.02 billion. In India, the company serves UHNIs, HNIs, and family offices through a distributor-led approach, supplemented by direct coverage. Twenty-one clients have collectively invested over ₹5,000 million across various funds.
People and Governance
The company had 277 employees as of June 30, 2026. Its senior management team has an average experience of approximately 23 years, with many leaders associated with the Edelweiss ecosystem for nearly 18 years. The company was named Asset Management Company of the Year in India by Asian Investor for three consecutive years.
Industry Outlook
India’s Alternatives Industry: Scale and Trajectory
India’s alternatives industry is in a structural growth phase. Total alternatives AUM stood at approximately $152 billion in December 2025 and is projected to reach $276 billion by 2030, implying annual growth of 110-14%. Yield and income strategies-encompassing private credit and real assets-are expected to grow at a sharper 17-19% CAGR, rising from $53.9 billion in CY2024 to $139.8 billion by CY2030, and are on track to command over 50% of the Indian alternatives market by 2030. India’s alternatives penetration remains low at roughly 3.5% of GDP, compared with 27.8% in North America, leaving substantial headroom.
Growth Drivers
I. Financialisation of household savings:
The combined share of mutual funds and equity in annual household savings rose from 4% in 2020 to 15% in 2025, with alternatives gaining traction as a yield and diversification tool.
II. Bank credit displacement:
Private credit accounts for just 0.6% of India’s GDP versus 4.1% in the US, creating a large addressable gap as corporates seek flexible long-term capital.
III. Asset monetisation:
Policy-led monetisation under the National Monetisation Pipeline and the InvIT/REIT framework is deepening the investable universe in operational infrastructure and real estate.
IV. Wealth creation:
India’s UHNI and HNI populations are projected to grow at 9.6% and 15.8% CAGR respectively by 2027, while family offices have expanded to over 300 from 45 in 2018, expanding the private wealth client pool.
Real Assets and Private Credit Sub-Outlook
I. Infrastructure and InvITs:
InvIT AUM stood at approximately ₹7 trillion in FY26 and is projected to reach ₹13.5 trillion by FY31, supported by roads, transmission, renewable energy, fibre, warehousing, and data-centre monetisation.
II. Real Estate:
India’s real estate market is estimated at $585.09 billion in 2026 and is projected to grow at a 9.63% CAGR to $926.56 billion by 2031, creating a deep pipeline for real estate credit and commercial office yield strategies.
III. Private Credit:
India’s alternative lending market is expected to reach $35.58 billion in 2026, growing at 16.4% annually, with a projected 13.7% CAGR through 2029. Special situations and performing credit remain under-penetrated relative to the scale of corporate refinancing needs.
How Will EAAA India Alternatives Limited Benefit
1. Direct participation in a $276 billion alternatives market by 2030:
EAAA’s diversified platform across Real Assets and Private Credit positions it to capture a meaningful share of the projected growth in Indian alternatives AUM.
2. Yield and income strategies as the fastest-growing pocket:
With over 50% of alternatives AUM expected to sit in yield-oriented strategies by 2030, EAAA’s core verticals-infrastructure yield, commercial real estate, and private credit-align directly with the dominant demand driver.
3. Scalable asset operating advantage:
Sekura’s on-ground operational capability differentiates EAAA in infrastructure and real estate, where active asset management can enhance returns and reduce downside risk.
4. Private credit gap creates a durable origination runway:
With private credit at only 0.6% of GDP versus 4.1% in the US, EAAA’s performing credit, special situations, and real estate credit funds address a large unmet financing need.
5. InvIT and REIT financialisation:
EAAA already manages two InvITs, giving it a first-mover position as the InvIT/REIT market doubles to approximately ₹20 trillion by FY31.
6. Wealth client penetration:
EAAA’s distributor-led model for HNIs, UHNIs, and family offices can scale as India’s private wealth pool expands, complementing its institutional client base.
7. Listed-platform credibility:
The IPO enhances brand visibility and governance transparency, which can support client acquisition and talent retention in a competitive alternatives market.
Peer Group Comparison (₹ in million, unless stated)
| Company | Face Value (₹) | Revenue | Diluted EPS (₹) | NAV (₹) | P/E (x) | RoNW (%) |
| EAAA India Alternatives Limited | 5 | 6,702.59 | 35.75 | 150.35 | 40.59 | 27.10 |
| Peer Group | ||||||
| 360 One WAM Limited | 1 | 32,950.90 | 26.08 | 179.74 | 45.87 | 19.31 |
| Aditya Birla Sun Life AMC Limited | 5 | 16,847.80 | 32.18 | 129.19 | 25.85 | 26.99 |
| Anand Rathi Wealth Limited | 5 | 9,390.95 | 36.17 | 81.18 | 85.51 | 45.48 |
| HDFC Asset Management Co. Ltd. | 5 | 34,984.40 | 57.44 | 190.14 | 45.20 | 32.36 |
| Gaja Alternative Asset Mgmt Ltd. | 5 | 1,219.99 | 5.71 | 37.33 | NA | 17.19 |
| Nippon Life India Asset Mgmt Ltd. | 10 | 22,306.90 | 20.03 | 66.38 | 43.99 | 31.39 |
| Nuvama Wealth Management Ltd. | 2 | 41,582.69 | 53.71 | 194.04 | 27.46 | 30.86 |
| UTI Asset Management Co. Ltd. | 10 | 18,510.90 | 57.11 | 359.37 | 19.07 | 18.09 |
| ICICI Prudential Asset Mgmt Co. Ltd. | 1 | 49,773.30 | 53.60 | 71.20 | 54.73 | 82.84 |
Key Strategies for EAAA India Alternatives Limited
Expand and Deepen Client Base Across Geographies.
EAAA India Alternatives Limited plans to leverage its in-house coverage team and global distribution platform to attract institutional and private wealth clients across geographies. With global institutional commitments already near $3.02 billion, the company aims to deepen existing relationships and penetrate untested markets through region-specific outreach, while capitalising on India’s growing share of APAC alternatives allocations.
Develop Income and Yield Product Offerings.
EAAA India Alternatives Limited intends to broaden its product suite, particularly in income and yield strategies across Real Assets and Private Credit. This includes scaling infrastructure yield, commercial office, energy transition, investment-grade credit, performing credit, special situations, and real estate credit funds, alongside perpetual vehicles such as InvITs and REITs to capture long-duration capital.
Leverage Technology for Operational Efficiency
EAAA India Alternatives Limited will continue investing in digital platforms for client acquisition, onboarding, and servicing, while deploying artificial intelligence, machine learning, drone-based monitoring, and predictive analytics across asset management. The objective is to sustain cost efficiencies, enhance client experience, and strengthen competitive positioning through technology-led differentiation.
Deepen Active Asset Management Capabilities
EAAA India Alternatives Limited plans to build on Sekura’s operational platform to drive value creation across portfolio assets. This includes predictive maintenance, centralized control-room monitoring, proprietary SOPs, and ISO-aligned processes across infrastructure, real estate, and energy assets, with a focus on maximising revenue, optimising costs, and maintaining governance standards.
Deliver Sustained Investment Performance and Portfolio Differentiation
EAAA India Alternatives Limited will maintain disciplined investment strategies underpinned by proprietary research, risk management, and active asset oversight. By expanding and diversifying its fund portfolio including newer strategies such as the India Energy Transition Fund-the company aims to meet evolving client needs and reinforce its track record across market cycles.
Strengthen Employee Value Proposition
EAAA India Alternatives Limited seeks to attract and retain high-quality talent through upskilling, mentoring, leadership development, and variable additional return structures that align employee incentives with fund performance. The company also recruits from top MBA programmes to build a diverse pipeline of future leaders, supporting scalability and institutional continuity.
SWOT Analysis of EAAA India Alternatives IPO
Strength and Opportunities
- Over 17 years of specialised experience in Indian alternative asset management.
- Diversified platform spanning Real Assets, Private Credit, and portfolio management services.
- AUM of ₹9,53,448.78 million and FPAUM of ₹4,86,231.76 million as of June 30, 2026.
- Strong client franchise with institutional, HNI, UHNI, and family office relationships across geographies.
- In-house asset operating capability through Sekura, covering operations, maintenance, and efficiency.
- Comprehensive pre- and post-investment risk management and governance architecture.
- Seasoned management team with deep domain expertise and long tenure.
- Structural tailwind: Indian alternatives AUM projected to reach ~$275 billion by 2030.
- Private credit penetration in India at just 0.6% of GDP versus 4.1% in the US, offering long runway.
Risks and Threats
- Entirely OFS issue; company receives no growth capital.
- Revenue concentration in fund management fees with limited annuity-like income streams.
- Exposure to credit risk within the Private Credit vertical, including special situations.
- Regulatory changes affecting AIF, InvIT, and REIT frameworks could alter economics.
- Competition intensifying from global alternative managers entering India.
- Fundraising cycles remain sensitive to interest rate and liquidity conditions.
- Limited domestic institutional participation constrains AUM scalability.
- Valuation multiples in alternative asset management have compressed amid rate volatility.
- Execution risk in scaling newer strategies such as energy transition and data centres.
Upcoming IPO News










Explore IPO Opportunities
Explore our comprehensive IPO pages to stay updated on the latest trends and insights.


All About EAAA India Alternatives Limited IPO
Established in 2008, Edelweiss Alternative Asset Advisors (EAAA) is a prominent alternative investment platform in India. It operates a diverse, multi-strategy framework targeting large, under-explored, and rapidly growing alternative asset classes, with a focus on delivering income and yield-oriented solutions to its clients.
The company’s primary business strategies encompass two key areas: (i) real assets and (ii) private credit. Over the years, EAAA has dedicated significant effort and resources to building a scalable, global platform that caters to a broad client base, including institutional investors, ultra-high-net-worth individuals (UHNIs), high-net-worth individuals (HNIs), and family offices.
As of September 30, 2024, EAAA reported ₹572.62 billion in assets under management (AUM), reflecting its 15 years of expertise and commitment to fostering growth in alternative investments.
Peer Comparison
- 360 One WAM Limited
SWOT Analysis of EAAA India Alternatives Limited
| Strengths and Opportunities | Weaknesses and Threats |
| Extensive experience with over 15 years in alternative investments, enhancing market credibility and investor confidence. | Exposure to market volatility affecting asset valuations and investment performance, potentially impacting returns. |
| Significant scale with ₹572.62 billion in Assets Under Management (AUM), reflecting robust growth and operational efficiency. | Dependence on regulatory frameworks; any adverse changes could impact operations and profitability. |
| Diversified, multi-strategy platform across large, fast-growing alternative asset classes, offering tailored income and yield solutions. | Competition from other alternative asset managers and financial institutions may pressure margins and market share. |
| Strong focus on private credit and real assets, tapping into under-served markets with high growth potential. | Potential liquidity risks associated with alternative investments, affecting the ability to meet short-term obligations. |
| Experienced team of 79 investment professionals, providing deep industry insights and effective investment management. | Operational risks related to managing a diverse portfolio across various sectors and asset classes. |
| Serving over 3,600 clients, including institutional investors, UHNIs, HNIs, and family offices, demonstrating a broad and diversified client base. | Challenges in scaling operations while maintaining personalized client services and investment performance. |
| Positioned to capitalize on India’s projected economic growth, expected to become the third-largest globally by 2030, attracting investors. | Economic downturns or slowdowns in India could adversely affect investment opportunities and returns. |
| Benefiting from the rise of alternative investment funds, one of the fastest-growing segments in India’s financial markets. | Changes in investor preferences or risk appetite could lead to reduced allocations to alternative assets. |
| Ability to offer bespoke solutions across various ticket sizes, catering to unique client requirements and enhancing client satisfaction. | Potential challenges in maintaining consistent performance across a wide range of investment products and strategies. |
| Expertise in sectors like performing credit, real estate credit, special situations, infrastructure yield, and energy transition, enabling investment in diverse opportunities. | Risks associated with investments in sectors subject to regulatory changes, such as energy transition and infrastructure. |
| Commitment to responsible investing, aiming to create a positive impact on the economy and society, aligning with global ESG trends. | Increasing emphasis on ESG criteria may require additional resources to ensure compliance and reporting, impacting operational costs. |
Other IPO Pages Linking
More About EAAA India Alternatives Limited
Leading Alternative Asset Platform in India
EAAA India Alternatives stands as a leading alternative asset manager in India, with over 15 years of expertise. As of September 30, 2024, the firm manages an impressive AUM of ₹572.62 billion. Its annual recurring revenue AUM (ARR AUM) has grown at a CAGR of 25.65% from ₹269.95 billion in FY 2022 to ₹426.22 billion in FY 2024, showcasing its ability to scale efficiently.
Diversified Business Strategies
Real Assets
- Investments in infrastructure, commercial real estate, and energy transition with low counterparty risk and long tenures.
- Sub-strategies include Infrastructure Yield (introduced in FY 2018), Commercial Real Estate Yield (FY 2023), Perpetual Capital (FY 2023), and Energy Transition (FY 2025).
- Managing three active funds and an Infrastructure Investment Trust (InvIT) with an ARR AUM of ₹178.45 billion.
Private Credit
- Offers structured credit solutions for corporates and projects underserved by traditional lenders.
- Sub-strategies include Performing Credit (introduced in FY 2010), Special Situations (FY 2012), Real Estate Credit (FY 2016), and Core Credit (FY 2018).
- Managing 10 active funds with an ARR AUM of ₹258.79 billion.
Other Strategies
- Includes portfolio management services (PMS) offering co-investment opportunities, with a combined ARR AUM of ₹8.19 billion.
ARR AUM Split Across Strategies
As of September 30, 2024:
- Real Assets: ₹178,446.05 million (40.06%)
- Private Credit: ₹258,788.35 million (58.10%)
- Others: ₹8,192.74 million (1.84%)
- Total: ₹445,427.14 million (100.00%)
As of March 31, 2024:
- Real Assets: ₹157,550.01 million (36.97%)
- Private Credit: ₹268,311.58 million (62.95%)
- Others: ₹357.77 million (0.08%)
- Total: ₹426,219.36 million (100.00%)
As of March 31, 2023:
- Real Assets: ₹119,943.76 million (31.41%)
- Private Credit: ₹261,979.41 million (68.59%)
- Others: NIL (0.00%)
- Total: ₹381,923.17 million (100.00%)
As of March 31, 2022:
- Real Assets: ₹39,983.45 million (14.81%)
- Private Credit: ₹229,964.98 million (85.19%)
- Others: NIL (0.00%)
- Total: ₹269,948.43 million (100.00%
Broad Client Base
EAAA caters to 3,682 global and domestic clients, including institutional investors, family offices, and UHNIs/HNIs. Repeat clients and a robust presence in India, North America, and Europe highlight its appeal.
With strong fund performance and a proven ability to raise capital, EAAA India Alternatives continues to solidify its position as a reliable and sustainable alternative investment platform.
Industry Outlook
Global Alternatives Industry: Size and Growth
- The global private alternatives industry is set for double-digit growth, with a CAGR of 10%-12% projected between CY23-CY29.
- This growth stems from increased institutional investor participation, demand for diversification, and the need for higher risk-adjusted returns.
- The AUM (Assets Under Management) for private alternatives includes dry powder and unrealized AUM from private equity, private credit, infrastructure, and real estate credit.
Past and Projected AUM Growth
- The industry’s AUM has quadrupled over the last decade, rising from USD 4.5 trillion in CY13 to USD 15.7 trillion in CY23.
- Projections indicate continued growth, reaching USD 29.1 trillion by CY29.
Regional Insights
- North America leads the market, followed by Europe, showcasing their maturity in private alternatives investments.
- APAC is an emerging hotspot, growing at 18.6% CAGR from CY13-CY23 and poised for 9%-11% CAGR between CY23-CY29.
- India and China are key drivers within APAC, fueled by rising institutional and HNI participation.
Key Drivers of Growth
- Diversification benefits.
- Potentially higher returns.
- Increasing demand for risk-adjusted asset classes.
With robust growth prospects, India stands out in APAC as an emerging leader in the private alternatives space.
Indian Alternative Industry
Industry Growth
- Asset Management in India has grown at a CAGR of 21.4% over the last decade (FY14-FY24).
- AUM increased nearly 7x to ₹74.5 trillion by FY24.
- Bank term deposits, growing at 9.3% CAGR, are losing share to asset management due to the appeal of higher returns.
Market Shift
- The share of asset management in financial investments rose to 37% in FY24 as term deposits dropped to 63%, reflecting investor preference for capital markets.
Growth of SEBI-Registered Alternatives in India
India’s SEBI-registered alternative investment industry is growing rapidly. As investors seek diversification and higher returns with lower volatility, these investments are gaining popularity. With regulatory reforms and rising interest, India’s alternative investment space is set for further expansion. AIF commitments in India have surged, reaching Rs 11.3 trillion by FY24, growing 86 times since FY14, with a CAGR of 56%, reflecting a strong, sustained annual growth rate in double digits.
Growth of Real Estate Investment Trusts (REITs) in India
REITs allow individuals to invest in real estate without direct ownership, offering exposure to diversified properties. As of Q1FY25, India has four listed REITs managing over Rs 1.4 trillion in assets.
The real estate investment sector in India has seen significant growth, particularly through Real Estate Investment Trusts (REITs) and Infrastructure Investment Trusts (InvITs).
- Cumulative Funds Raised: REITs in India raised funds steadily, growing at a CAGR of 16% between FY21 and FY24.
- Types of REITs:
- REITs: Invest in income-generating real estate like offices and retail spaces.
- SM REITs: Focus on smaller investments, with stricter asset requirements.
InvITs Overview
- InvITs pool capital to invest in infrastructure assets like roads and power plants.
- Growth: InvITs raised over Rs 1 trillion and manage assets worth Rs 5 trillion as of March 2024.
Outpacing Traditional Investments
- Growth Rate: SEBI-registered alternatives (REITs and InvITs) grew at a high CAGR of 33%, surpassing mutual funds and bank term deposits.
- Asset Share: The share of SEBI-registered alternatives in asset management grew from 1.2% in FY14 to 15.8% in FY24, reflecting increasing investor interest.
Growth Drivers for SEBI Registered Alternatives in India
The India Alternatives Market has been shaped by several key factors, categorized into macro, demand-side, and supply-side drivers.
- Macro Factors:
- Rising Income Levels: Growing wealth at individual and institutional levels drives demand for diversified investment options.
- High Gross Savings Rate: India’s savings rate surpasses global averages, fueling capital market investments.
- Regulatory Support: Progressive regulations like standardized PPMs and IFSC authorization promote transparency and growth.
- Demand-Side Factors:
- Preference for Non-traditional Investments: Investors seek higher returns, pushing demand for alternatives.
- Access to Information: Easy access through digital platforms boosts awareness and participation.
- Tailored Investment Strategies: Customization of portfolios for sector-specific investments increases appeal.
- Supply-Side Factors:
- Increased Deployment of Savings: Households are shifting investments toward capital market assets, including AIFs.
- Foreign and Domestic Capital Inflows: Rising foreign investments and domestic wealth expansion drive industry growth.
- Institutional Capital Diversification: Growing institutional interest in alternatives is expected to further fuel market expansion.
Growth of India’s Alternative Investment Industry
India’s alternative investment industry has witnessed substantial growth over the past decade, driven by increasing investor interest and a favorable regulatory environment.
Industry Growth and Market Size
- AUM Growth: The Assets Under Management (AUM) of India’s Alternative Investment Funds (AIF) industry grew from USD 55.2 billion in 2013 to USD 124.3 billion in 2023, reflecting a CAGR of 8.5%.
- Projections: By 2028, the industry is expected to reach USD 238 billion, growing at a CAGR of 13% to 15%.
Key Drivers of Growth
- Investor Awareness: Growing awareness of alternative investments beyond traditional asset classes.
- Regulatory Evolution: Continuous improvements in India’s investment framework.
- Financial Literacy: Increased financial knowledge across the population.
- High Net-Worth Individuals: The rising number of wealthy individuals in India.
Key Segments: Private Credit, Real Assets, and Private Equity
- Private Credit: Growing at a CAGR of 23.5%, private credit AUM has surged from USD 2.5 billion to USD 20.6 billion in 10 years. It is expected to expand significantly due to the increasing credit gap.
- Real Assets: From USD 22.0 billion to USD 26.8 billion between 2013 and 2023, real assets provide stable returns and are expected to grow as their penetration in India remains low.
- Private Equity: With a strong CAGR of 9.6%, private equity has expanded from USD 30.7 billion to USD 76.9 billion.
Future Outlook
- Private Credit Dominance: Expected to grow rapidly and capture a larger market share by 2028.
- Market Penetration: The penetration of alternatives in India is still low compared to global markets, offering significant growth opportunities.
How Will EAAA India Alternatives Limited Benefit?
- Strong Position in India’s Growing Alternative Investment Market
EAAA India Alternatives is positioned to benefit from India’s booming alternative investment market, which has seen a substantial increase in Assets Under Management (AUM), growing nearly sevenfold to ₹74.5 trillion by FY24, highlighting its potential for further growth.
- Diversified Investment Strategies
With its diversified strategies in real assets and private credit, EAAA India Alternatives is well-placed to capitalize on the increasing demand for higher returns and diversification among investors. This positions the firm to benefit from the rising popularity of alternative investments.
- Expansive Client Base
EAAA India Alternatives serves a broad client base of 3,682 global and domestic clients, including institutional investors and high-net-worth individuals. This large, diverse clientele enables the firm to tap into the growing institutional and individual interest in India’s alternative investment space.
- Proven Capital Raising and Fund Performance
The firm’s strong fund performance and established capital-raising capabilities enhance its reputation in the market. This attracts more investors seeking exposure to India’s expanding alternative investment market, positioning EAAA to secure a greater share of investor capital.
- Strategic Focus on Fast-Growing Asset Classes
EAAA India Alternatives is well-positioned to benefit from the rapid growth of emerging asset classes, such as private credit and real assets. This strategic focus aligns with the industry’s expansion, positioning the firm to capitalize on projected double-digit growth in the global private alternatives industry.
- Global Reach and Market Diversification
With a solid presence in India, North America, and Europe, EAAA India Alternatives can tap into diverse markets, benefiting from the increasing global interest in alternative investments. The firm’s international footprint enables it to attract a wide range of investors globally.
EAAA India Alternatives Limited IPO Overview
Edelweiss Alternative Asset Advisors (EAAA), a subsidiary of Edelweiss, has submitted its Draft Red Herring Prospectus (DRHP) to the Securities and Exchange Board of India (SEBI) for a ₹1,500 crore Initial Public Offering (IPO). The IPO is a complete offer for sale (OFS), with Edelweiss Securities and Investments Private Limited acting as the selling shareholder. The offer involves the sale of shares with a face value of ₹5 each, allowing existing shareholders to exit and providing a platform for public investment in the firm. This marks a significant step for EAAA in expanding its reach.
Why is EAAA India Alternatives Limited Going Public?
EAAA India Alternatives Limited is going public through an Initial Public Offering (IPO) to facilitate an Offer for Sale (OFS) of ₹1,500 Cr worth of shares. The entire proceeds from this offering will go to the selling shareholder, Edelweiss Securities and Investments Private Limited.
- Strategic Move for Liquidity and Market Exposure: This IPO is a strategic move to increase liquidity and enhance the company’s market visibility.
- Visibility: By going public, EAAA aims to tap into the capital markets, providing an opportunity for investors to buy shares and for the selling shareholder to monetize its stake in the company.
EAAA India Alternatives Limited Upcoming IPO Details
| Category | Details |
| Issue Type | Book Built Issue IPO |
| Total Issue Size | Fresh Issue: NA |
| Offer for Sale: ₹1500 crores | |
| IPO Dates | TBA |
| Price Bands | TBA |
| Lot Size | TBA |
| Face Value | ₹5 per share |
| Listing Exchange | BSE, NSE |
| Shareholding pre-issue | TBA |
| Shareholding post -issue | TBA |
Important Dates
| IPO Activity | Date |
| IPO Open Date | TBA |
| IPO Close Date | TBA |
| Basis of Allotment Date | TBA |
| Refunds Initiation | TBA |
| Credit of Shares to Demat | TBA |
| IPO Listing Date | TBA |
IPO Lots
| Application | Lots | Shares | Amount |
| Retail (Min) | TBA | TBA | TBA |
| Retail (Max) | TBA | TBA | TBA |
| S-HNI (Min) | TBA | TBA | TBA |
| S-HNI (Max) | TBA | TBA | TBA |
| B-HNI (Min) | TBA | TBA | TBA |
Lead Managers
| Lead Managers |
| Axis Capital Limited |
| Jefferies India Private Limited |
| Motilal Oswal Investment Advisors Limited |
| Nuvama Wealth Management Limited |
EAAA India Alternatives Limited IPO Valuation Overview
| KPI | Value |
| Earnings Per Share (EPS) | 27.25 |
| Price/Earnings (P/E) Ratio | TBD |
| Return on Net Worth (RoNW) | 27.30% |
| Net Asset Value (NAV) | 113.48 |
| Return on Equity | 27.30% |
| Return on Capital Employed (ROCE) | – |
| EBITDA Margin | 43.50% |
| PAT Margin | 29.98% |
| Debt to Equity Ratio | 0.61 |
Peer Group Comparison
| Name of Company | Face Value (₹) | Revenue
(₹ Million) |
EPS (₹) | Basic EPS (₹ per share) | NAV (₹ per share) | P/E | RoNW (%) |
| EAAA India Alternatives Limited | 5 | 5838.54 | 27.25 | 27.25 | 113.48 | NA | 27.30 |
| 360 One WAM Limited | 1 | 25070.30 | 22.48 | 21.86 | 96.13 | 49.38 | 23.31 |
Key Insights
- Face Value (₹): The face value of a company represents the nominal value of its shares. For EAAA India Alternatives Limited, the face value is ₹5 per share, while for 360 One WAM Limited, it is ₹1 per share. A lower face value often implies a larger number of shares in circulation, which can impact stock liquidity and pricing strategy.
- Revenue (₹ Million): EAAA India Alternatives Limited has generated ₹5838.54 million in revenue, significantly lower than 360 One WAM Limited’s ₹25,070.30 million. This suggests that while EAAA operates in a similar industry, its revenue generation scale is smaller compared to its listed peer, reflecting potential differences in business operations.
- EPS (₹): EAAA India Alternatives Limited has an Earnings Per Share (EPS) of ₹27.25, while 360 One WAM Limited reports an EPS of ₹22.48. EAAA’s higher EPS indicates better profitability per share, which could be appealing to investors seeking strong earnings returns on their investments.
- Basic EPS (₹ per share): The basic EPS for EAAA India Alternatives Limited stands at ₹27.25, compared to ₹21.86 for 360 One WAM Limited. The higher basic EPS of EAAA suggests a stronger ability to generate earnings, which may be more attractive to investors seeking consistent growth and stable returns on their investments.
- NAV (₹ per share): EAAA India Alternatives Limited has a Net Asset Value (NAV) per share of ₹113.48, higher than the ₹96.13 NAV of 360 One WAM Limited. A higher NAV indicates that EAAA holds greater net assets per share, potentially making its stock more valuable and secure from a financial standpoint.
- P/E (Price-to-Earnings Ratio): EAAA India Alternatives Limited does not report a Price-to-Earnings (P/E) ratio, indicating that the company may not yet have consistent profits or is in the early stages of its growth phase. On the other hand, 360 One WAM Limited has a P/E ratio of 49.38, suggesting that it is priced higher relative to its earnings, reflecting investor optimism.
- RoNW (%): EAAA India Alternatives Limited has a Return on Net Worth (RoNW) of 27.30%, indicating efficient use of equity capital to generate profits. In contrast, 360 One WAM Limited’s RoNW of 23.31% is slightly lower, suggesting that EAAA has a better ability to deliver profits on the equity invested by shareholders.
EAAA India Alternatives Limited IPO Strengths
- Scaled and Experienced Player in India’s Real Assets and Private Credit Market
EAAA is a seasoned leader in India’s real assets and private credit market, leveraging over 15 years of experience. It plays a significant role in India’s expanding investment sector, particularly in private credit and real assets. With a robust market position, the company successfully capitalizes on the rapid growth in India’s alternative investment market, which is projected to grow significantly in the coming years.
- Diversified Multi-Strategy Platform with Consistent Track Record
As a diversified multi-strategy platform, EAAA offers a broad array of investment products focused on income-generating sub-strategies. It operates across several key sectors, such as real estate, credit, and energy transition, providing tailored solutions to meet client needs. The company’s consistent track record in delivering robust results demonstrates its strong expertise and commitment to generating long-term value for its investors.
- Strong Focus on Client Relationships and Global Presence
The company places high importance on client trust, satisfaction, and long-term relationships. Its strong presence across multiple regions, including North America, Europe, and Asia, along with a dedicated client servicing platform, enables it to meet the evolving needs of both domestic and international clients. This global reach and personalized approach help foster superior client experiences and ensure continued growth and expansion.
- Technology-Enabled Institutional Platform
The company leverages in-house and third-party technology to enhance client experiences, optimize efficiency, and ensure scalability. Through AI-powered onboarding, automated recovery management, and streamlined processes, it reduces turnaround times and operational costs. Automation tools improve data integrity, simplify fund operations, and expedite approval processes, enabling scalable growth, strategic decision-making, and improved client satisfaction and performance.
- Dedicated Portfolio Operating and Management Platform
Sekura, a subsidiary, manages most of the company’s funds’ portfolio assets, including infrastructure, real estate, and energy operations in over 10 states in India. The platform focuses on asset quality through extensive due diligence, experienced teams, and a ‘PPT’ approach. Sekura’s strategy is driven by robust processes, technology, and a commitment to operational efficiency, ensuring sustainable asset management.
- Comprehensive Risk Management Systems
The company has implemented a proactive risk management framework that assesses risks at both pre-investment and post-investment stages. Their risk governance includes independent assessments, regular monitoring, and alignment with global ESG best practices. The team utilizes advanced technology, such as real-time heat maps and automated tools, for efficient monitoring and mitigation of risks, ensuring the security of assets.
- Led by a Seasoned Management Team with Extensive Industry Experience
The senior management team boasts an average of 23 years of industry experience and a track record of success across economic cycles. Their leadership, stability, and commitment to the company’s investment philosophy have contributed to significant growth in assets under management (AUM). The team’s long-term tenure fosters value creation and aligns the interests of the company, its clients, and its employees.
Objectives of the IPO Proceeds
The Promoter Selling Shareholder will be entitled to receive the entire proceeds from the Offer, after deducting the Offer expenses and applicable taxes. The Company will not receive any proceeds from the Offer.
EAAA India Alternatives Limited Financials (in million)
| Particulars | 30 Sept 2024
|
31 Mar 2024 | 31 Mar 2023 | 31 Mar 2022 |
| Assets | 18908.83 | 17696.60 | 12370.43 | 3103.32 |
| Revenue | 4144.58 | 5842.50 | 7012.26 | 2159.68 |
| Profit After Tax | 1236.78 | 1751.61 | 3221.93 | 489.33 |
| Reserves and Surplus | 8365.06 | 4806.37 | 2013.29 | 321.34 |
| Total Borrowings | 4048.89 | 4448.29 | 2445.16 | 848.64 |
| Total Liabilities | 10222.36 | 10401.77 | 6833.39 | 1558.23 |
Key Insights from Financial Performance
- Assets: The company’s assets have seen substantial growth, increasing from ₹3,103.32 million in March 2022 to ₹18,908.83 million by September 2024. This significant rise in assets indicates a strong expansion, suggesting that the company has effectively utilized its resources and investments to enhance its overall value.
- Revenue: Revenue has experienced a decline in recent periods, peaking at ₹7,012.26 million in March 2023 but falling to ₹4,144.58 million by September 2024. This reduction, particularly from March 2024’s ₹5,842.50 million, points to challenges in maintaining revenue levels and could indicate external or internal factors affecting sales performance.
- Profit After Tax (PAT): Profit After Tax (PAT) has fluctuated significantly, growing from ₹489.33 million in March 2022 to ₹1,236.78 million in September 2024. However, it remains lower than the ₹3,221.93 million recorded in March 2023. The decline in PAT suggests possible profitability issues despite the increase in assets, potentially due to decreased revenue or higher costs.
- Reserves and Surplus: The company’s reserves and surplus have demonstrated robust growth, expanding from ₹321.34 million in March 2022 to ₹8,365.06 million by September 2024. This surge indicates strong retention of earnings, improving the company’s financial stability and providing a solid buffer for future investments or unexpected financial challenges.
- Total Borrowings: Total borrowings have risen substantially, from ₹848.64 million in March 2022 to ₹4,048.89 million by September 2024. This increase in debt could reflect the company’s strategy to leverage borrowed funds to support its expansion. While borrowings provide growth opportunities, they also raise concerns about the company’s future debt management and repayment obligations.
- Total Liabilities: The company’s total liabilities have grown from ₹1,558.23 million in March 2022 to ₹10,222.36 million in September 2024. This increase in liabilities is consistent with the rise in borrowings, highlighting the company’s growing financial obligations. It also indicates the extent to which the company is relying on external funding to support its operations and expansion strategies.
Other Financial Details
- Finance Costs: Finance costs have decreased from ₹364.84 million in March 2024 to ₹225.35 million in September 2024, indicating improved financial management or reduced debt levels. However, they remain higher than ₹187.03 million in March 2023, suggesting ongoing financial leverage or higher interest rates.
- Impairment on Financial Instruments: Impairment on financial instruments has been negligible, with no impairments recorded in September 2024 and March 2024, compared to minor negative amounts in previous years. This indicates improved asset quality or fewer write-offs, reflecting a positive trend in managing credit risk.
- Employee Benefits Expense: Employee benefits expense decreased to ₹1,512.67 million in September 2024 from ₹2,565.99 million in March 2023. This reduction may reflect cost-cutting measures or workforce optimization. However, the figure remains higher than ₹1,005.32 million in March 2022, signaling the company’s growing investment in human resources.
- Depreciation and Amortisation: Depreciation and amortisation costs have remained relatively stable, with a slight increase over the years. From ₹14.29 million in March 2022, it rose to ₹51.02 million in September 2024. This increase reflects the company’s expanding asset base, with higher investments in tangible and intangible assets.
- Other Expenses: Other expenses have decreased from ₹1,130.03 million in March 2024 to ₹775.51 million in September 2024, suggesting cost containment efforts. However, they are still higher than ₹533.78 million in March 2022, indicating that as the company expands, operational costs have grown accordingly.
Key Strategies for EAAA India Alternatives Limited
- Strategic Expansion and Client Growth
As of September 30, 2024, the company has expanded its client base globally, managing nearly US$3.76 billion across multiple institutional clients. By addressing unmet needs in the U.S. and Indian markets, it has attracted substantial investments. The dual “Whale & the Long Tail” strategy has successfully raised over US$100 million from 12 key clients, positioning the company for growth.
- Expanding Product Offerings and Private Credit Strategy
The company aims to enhance its Real Assets strategy by acquiring growth-oriented assets, incorporating advanced ESG parameters, and focusing on infrastructure, energy, and real estate growth. Simultaneously, it will expand its Private Credit business, targeting customized financing solutions across core, performing, and special situations, while leveraging changes in India’s regulatory landscape and the growing demand for private credit.
- Leveraging Technology for Operational Efficiency and Client Experience
The company is committed to advancing its operational efficiency and client experience through continuous technological and digital innovations. By investing in AI, machine learning, and predictive analytics, it enhances client acquisition, improves asset management, and ensures seamless interactions. With a focus on sustainability and data-driven insights, the company aims to maintain its competitive edge, drive growth, and create long-term value.
- Focusing on Active Asset Management with Technology Integration
The company focuses on enhancing active asset management by leveraging technology and operational capabilities. Utilizing POMT’s smart platform, AI, machine learning, remote monitoring, predictive maintenance, and drones, it aims to optimize data analysis, automate processes, improve governance, and drive operational efficiency for better investment outcomes and client experiences.
- Focusing on Sustained Investment Performance and Portfolio Differentiation
The company is committed to delivering consistent investment performance and portfolio differentiation through disciplined, research-driven strategies and active asset management. Its diversified approach across Real Assets and Private Credit ensures stable, long-term yields. By continuously innovating and expanding its portfolio, the company aims to strengthen its competitive position and meet evolving client needs.
- Strengthening Employee Value Proposition
The company strengthens its employee value proposition to attract and retain high-quality talent, focusing on senior management and investments. By investing in upskilling, mentoring, and leadership development, the company nurtures leadership at all levels. Additionally, it recruits from top MBA institutions, fostering a diverse talent pool for future growth.
Competitor Analysis of EAAA India Alternatives Limited
1. 360 One WAM Limited
360 One WAM Limited provides a comprehensive range of alternative investment strategies, focusing on wealth management and private equity. EAAA’s offering, backed by Edelweiss, has a strong institutional backing and aims to expand its reach through an IPO, providing wider investor participation opportunities compared to 360 One WAM.
2. Kotak Investment Advisors
Kotak Investment Advisors offers diverse alternative investment strategies in private equity, real estate, and infrastructure. EAAA, focusing on a complete offer for sale (OFS), also targets these segments but may have a more niche approach, leveraging its strong market position under Edelweiss for broader outreach and investor access.
3. ICICI Venture
ICICI Venture specializes in private equity and venture capital, offering investment solutions across various sectors. EAAA differentiates itself by focusing on a complete OFS structure, providing liquidity options to existing shareholders while offering potential for public investment, which may appeal to investors seeking stability and exit options.
4. IIFL Wealth Management
IIFL Wealth Management focuses on offering alternative investment opportunities to high-net-worth individuals (HNWIs), providing tailored solutions. EAAA, while similarly focused on asset management, provides a more institutional approach to public investors through its IPO, making its offerings more accessible to a broader investor base.
How to apply IPO with HDFC SKY?
Follow these simple steps to apply for an IPO through HDFC SKY. Secure your investments and explore new opportunities with ease by accessing the IPOs available on the platform.
- 1Login to your HDFC SKY Account
- 2Select Issue
- 3Enter Number of Lots and your Price.
- 4Enter UPI ID
- 5Complete Transaction on Your UPI App
FAQs On EAAA India Alternatives Limited IPO
What is the issue size of the EAAA India Alternatives IPO?
When does the EAAA India Alternatives IPO open and close?
What is the price band and minimum investment?
On which exchanges will EAAA India Alternatives list?
Will the company receive any funds from the IPO?


Invest Anytime, Anywhere


By signing up I certify terms, conditions & privacy policy