Nifty 50
- ICICI Bank₹1,32330.80 (2.38%)
- Apollo Hospitals₹8,085-574.00 (-6.63%)
- Kotak Mahindra Bank₹4159.00 (2.22%)
- Max Healthcare₹925-57.10 (-5.81%)
- InterGlobe Aviation₹4,96593.00 (1.91%)
- BSE₹3,088-112.00 (-3.50%)
- Tech Mahindra₹1,533.4022.90 (1.52%)
- Adani Enterprises₹2,886.10-86.80 (-2.92%)
- TCS₹2,055.7023.30 (1.15%)
- SBI Life Insurance ₹1,684.70-50.30 (-2.90%)
- Shriram Finance₹982.5011.00 (1.13%)
- Eternal₹318.60-9.25 (-2.82%)
- Axis Bank₹1,22512.90 (1.06%)
- ONGC₹223.65-6.35 (-2.76%)
- Hindustan Unilever₹1,879.6015.80 (0.85%)
- Adani Ports₹1,779-43.00 (-2.36%)
- Bajaj Auto₹10,89988.00 (0.81%)
- Nestle₹1,314.30-31.40 (-2.33%)
- UltraTech Cement₹10,88859.00 (0.54%)
- Infosys₹995.30-20.10 (-1.98%)

- Offerings
- Tools & Platforms
Tools & Calculators
- Open API
- Calculators
- SIP Calculator
- CAGR Calculator
- Compound Interest Calculator
- FD Calculator
- RD Calculator
- EPF Calculator
- Retirement Calculator
- HDFC SIP Calculator
- Mutual Fund Return Calculator
- Lumpsum Calculator
- Step Up SIP Calculator
- ETF SIP Calculator
- Brokerage Calculator
- Equity Margin Calculator
- SWP Calculator
- EMI Calculator
- MTF Calculator
- Margin Pledge Calculator
- Algo Strategy
- Markets
Stocks
F&O
Mutual Funds
- More
Extreme Fear Grips D-Street as Market Mood Index Falls To 20.49
Authored By HDFC SKY | Last Modified: Sep 30, 2026 01:51 PM IST
Open Free Demat Account
Open Free Demat Account
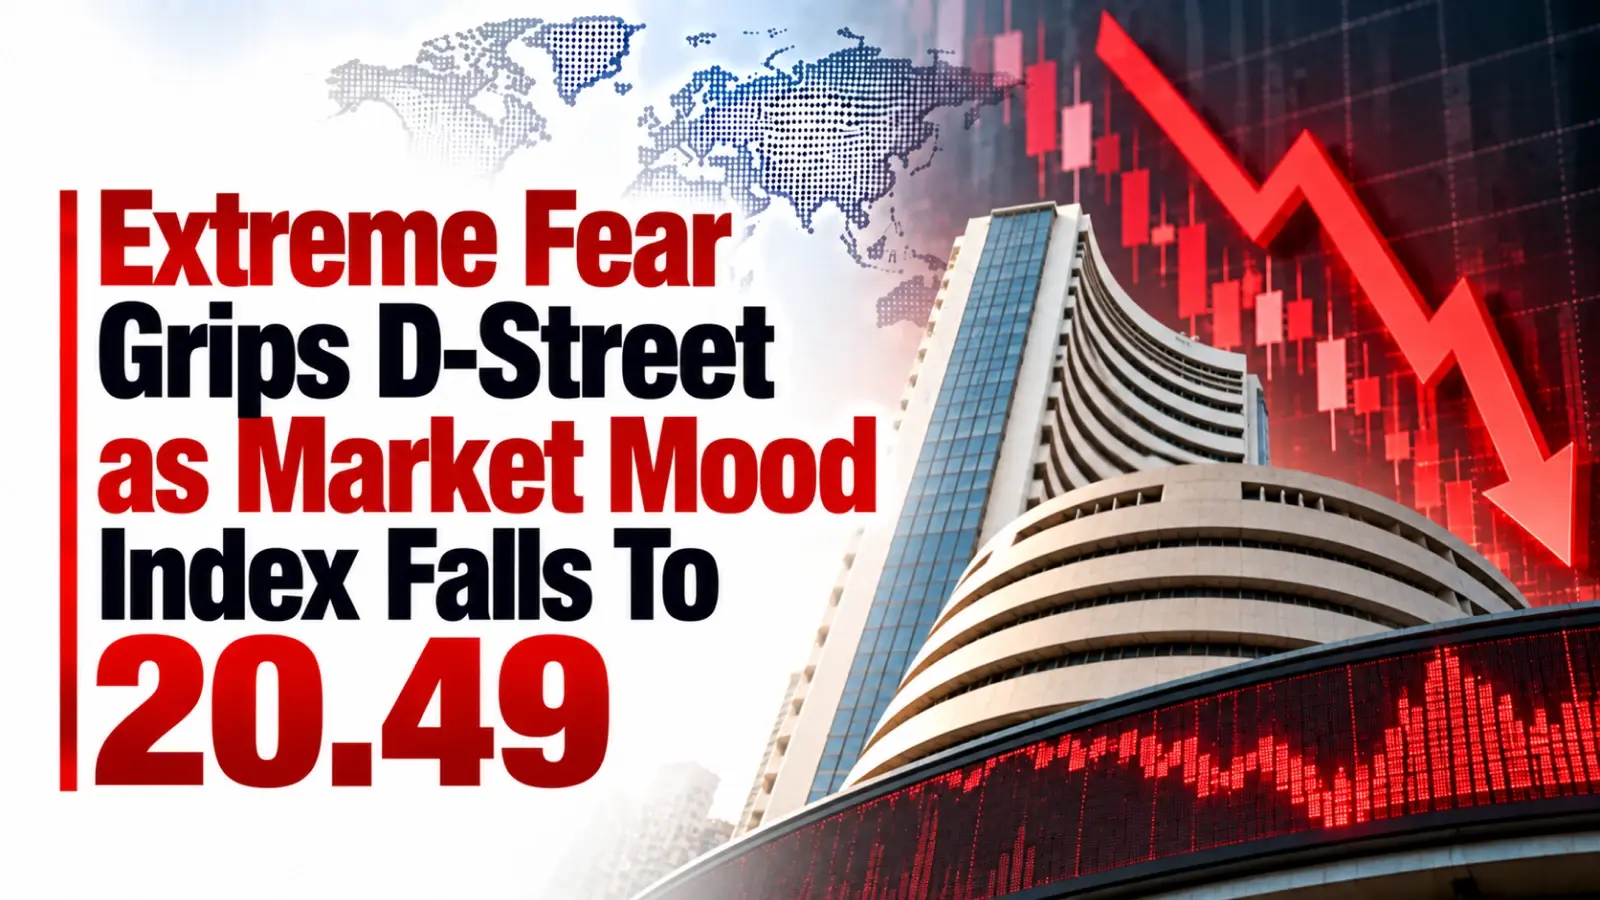
Mumbai, Sept 30: Currently, the Market Mood Index (MMI) stands at 20.49 on Tickertape, which means the market is in the extreme fear category. The index has received over 225,000 views on Tickertape and has hovered in the green region of extreme fear.
According to Tickertape, when the MMI dips below 30, it usually means that the market is oversold, and investors can look to take some long positions.
The Market Mood Index helps you understand the mood of the market at any point in time. It was created by a US-based firm called MarketPsych, which specialises in quantitative behavioural finance research. The firm developed this index using various parameters.
It uses news sentiment, social media activity and trading data to determine whether the market is oversold (0) or extremely greedy (100).
Essentially, the MMI acts as a thermometer for the stock market. It tells you whether the market is feeling fearful or positive. The lower the number, the more negative the market sentiment, and vice versa. Some of the metrics used include market volatility, institutional buying and selling activity, market breadth, momentum and price strength. A reading of 50 represents the midpoint.
Behavioural finance examines how people follow herd mentality, become overconfident and fear losing money. MarketPsych uses several different metrics to calculate the MMI. These range from analysing published news and social media discussions to examining stock prices and trading activity. Sentiment indices are unique because of the variety of information they use, unlike the India VIX, which primarily looks at prices.
Some of the metrics used are market volatility, momentum and price strength. Volatility tells us whether the market is experiencing sharp price movements. Momentum measures how quickly stocks have moved in recent days. Price strength looks at stocks trading near their highs and whether more stocks are trading closer to their highs than their lows. Market breadth tells us how many stocks are rising compared with how many are falling. Institutional buying and selling activity indicates whether institutions such as mutual funds and FPIs are buying or selling stocks. All these metrics help determine the MMI reading.
A reading between 71 and 100 indicates extreme greed. This means investors are feeling overly positive about the market and are buying stocks aggressively. Once the index crosses 80, investors should be careful with their money and may want to avoid investing. A reading between 51 and 70 indicates greed. The market is feeling positive, and stock prices may see an increase. However, if investors become too greedy, they could end up losing money.
A reading of 50 means that the market is neutral, neither fearful nor greedy. When the index is between 30 and 49, the market is in the fear category. This means investors are starting to get scared but are not necessarily selling everything they own. Extreme fear is indicated by a reading below 30, which is where the index stands right now. During periods of extreme fear, many investors start selling because they believe the market will continue to fall. This happened during the pandemic.
Oversold markets can always recover. However, keep in mind that the MMI is just one metric to consider when deciding what to do with your money. The MMI is currently at 20.49, well within the extreme fear range. Market sentiment has been negative due to the conflict in the Middle East and fluctuations in oil prices. There are many indicators that can help you assess where the market is headed, but keep an eye on the MMI, along with the India VIX, market breadth and other indicators.
Many people enjoy tracking the Market Mood Index because it tells them how investors are feeling about the market in a single number. However, always remember to consider other factors as well.
Sources
- Tickertape MMI
- MarketPsych
Disclaimer
At HDFC SKY*, we take utmost care and due diligence in curating and presenting news and market-related content. However, inadvertent errors or omissions may occasionally occur.
If you have any concerns, questions, or wish to point out any discrepancies in our content, please feel free to write to us at content@hdfcsec.com.
Please Note: The information shared is intended solely for informational purposes and does not make any investment recommendations.
HDFC SKY from HDFC Securities, one of most trusted trading platforms in India, has been recognized with the *Next-Gen Digi Content Awards 2025-26.
 Join Us
 Add as preferred source on Google


More Markets News


1 min read
1 min read






Open Free Demat Account
Open Free Demat Account










Invest Anytime, Anywhere


By signing up I certify terms, conditions & privacy policy