Nifty 50
- Eicher Motors₹7,404.50120.00 (1.65%)
- Axis Bank₹1,241.10-48.90 (-3.79%)
- UltraTech Cement₹11,080173.00 (1.59%)
- HDFC Bank₹714-14.85 (-2.04%)
- Adani Ports₹1,776.2025.40 (1.45%)
- Infosys₹1,138.95-22.25 (-1.92%)
- ONGC₹224.752.75 (1.24%)
- Hindustan Unilever₹1,863.30-30.50 (-1.61%)
- Maruti Suzuki₹11,631142.00 (1.24%)
- HDFC Life Insurance ₹544.40-8.60 (-1.56%)
- L&T₹3,67042.90 (1.18%)
- Trent₹2,916-42.70 (-1.44%)
- Reliance Industries₹1,222.6011.40 (0.94%)
- Apollo Hospitals₹7,784-106.00 (-1.34%)
- SBI₹971.508.90 (0.92%)
- Tata Consumer ₹967.80-11.10 (-1.13%)
- Power Grid Corp₹252.351.90 (0.76%)
- ICICI Bank₹1,381.50-15.50 (-1.11%)
- JSW Steel₹1,224.808.50 (0.70%)
- Bajaj Finserv₹1,710.60-18.40 (-1.06%)

- Offerings
- Tools & Platforms
Tools & Calculators
- Open API
- Calculators
- SIP Calculator
- CAGR Calculator
- Compound Interest Calculator
- FD Calculator
- RD Calculator
- EPF Calculator
- Retirement Calculator
- HDFC SIP Calculator
- Mutual Fund Return Calculator
- Lumpsum Calculator
- Step Up SIP Calculator
- ETF SIP Calculator
- Brokerage Calculator
- Equity Margin Calculator
- SWP Calculator
- EMI Calculator
- MTF Calculator
- Margin Pledge Calculator
- Algo Strategy
- Markets
Stocks
F&O
Mutual Funds
- More
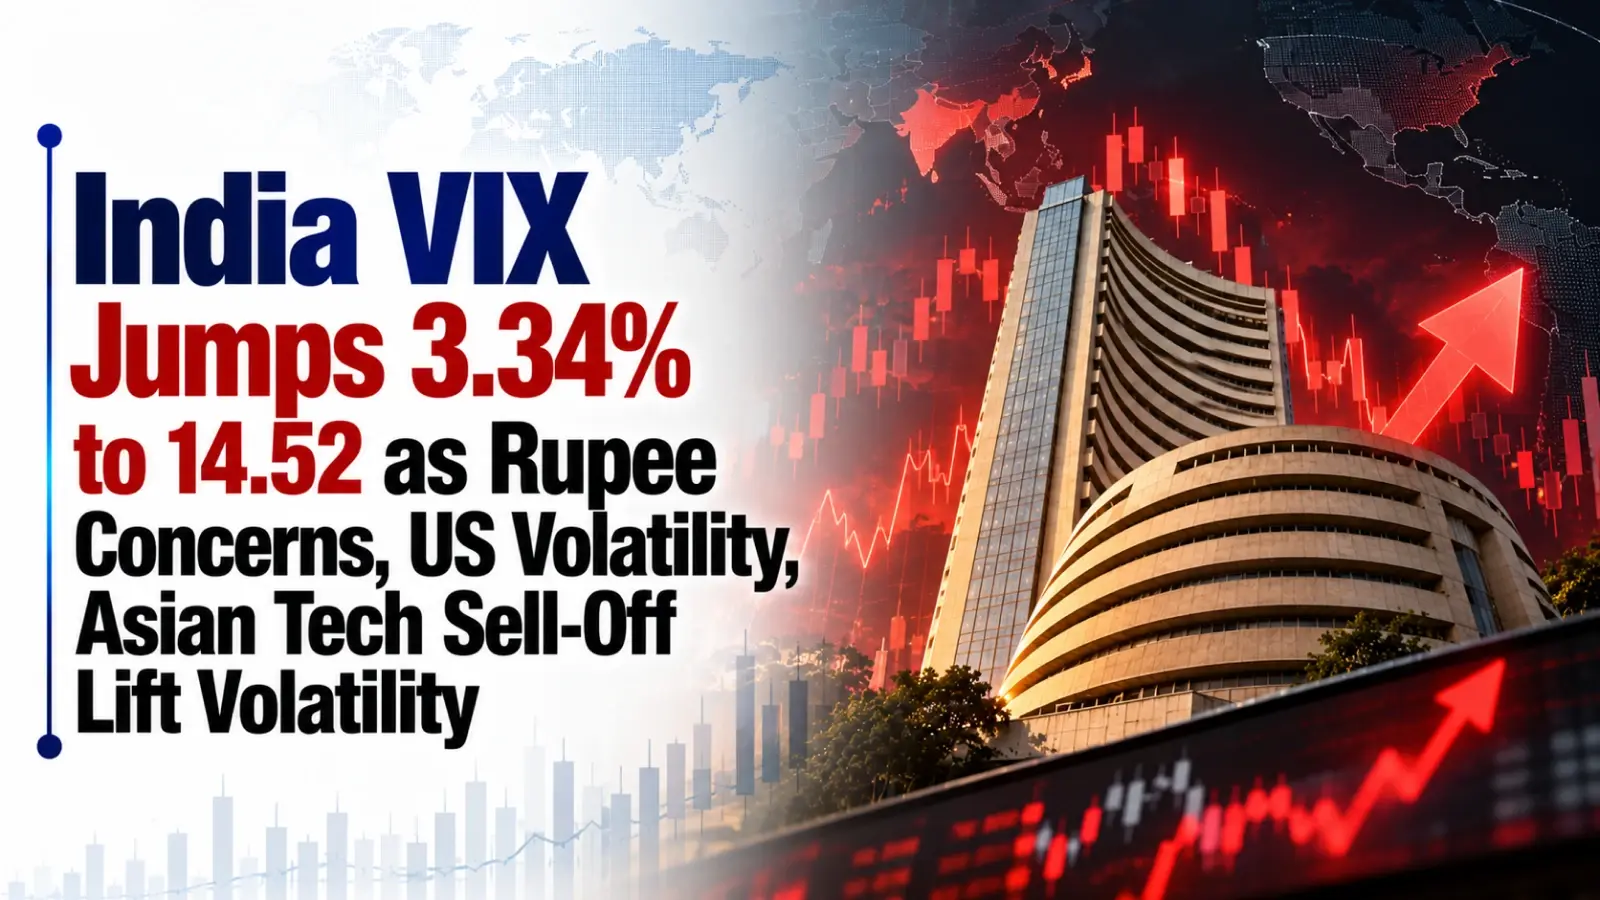
India VIX Jumps 3.34% to 14.52 as Rupee Concerns, US Volatility, Asian Tech Sell-Off Lift Volatility
Authored By HDFC SKY | Published at: Oct 19, 2026 10:43 AM IST
Open Free Demat Account
Open Free Demat Account
Mumbai, 19 October 2026: India’s volatility gauge, the India VIX, climbed 3.34% to 14.52 in early trade on Monday, as investors weighed a cautious domestic opening against mixed global cues. The index, which measures expected near-term volatility derived from Nifty option prices, opened at 14.06 before rising to an intraday high of 14.83 and a low of 13.31. The reading remains well below its 52-week high of 28.90 but above the 52-week low of 8.72, reflecting a market that is alert but not in panic mode.
The early-session move came as the Nifty 50 opened lower at 23,096.85, down 49.30 points or 0.21%, while the Sensex opened at 74,594.65, down 134.62 points or 0.18%. By 09:18 IST, the Nifty had recovered to 23,140.5, down just 0.02%, and the Sensex stood at 74,691.38, down 0.05%, indicating that initial selling pressure was not uniformly sustained. India VIX was reported at 14.32 at 09:18 IST, up 1.85%, before extending gains to the 14.52 level later in the morning session.

FPI Outflows of ₹52,100 Crore in October Add to Risk Backdrop
A report published on Monday said foreign portfolio investors had withdrawn approximately ₹52,100 crore from Indian equities during October to date. The outflows were linked to elevated crude prices, higher US bond yields and a stronger dollar. This was a month-to-date condition reported today, not evidence that the entire amount was withdrawn during the opening session.
Persistent foreign selling can increase the perceived risk of further declines in Indian equities, prompting traders to buy protective puts or reduce exposure ahead of uncertain flows. If selling becomes broad-based, implied volatility can rise across multiple Nifty strikes. However, domestic institutional buying and selective sector strength can absorb foreign selling.
Reports indicated that 11 of 16 major sectors were positive around 09:18 IST, despite the muted benchmark performance. Foreign flows formed part of the risk backdrop, but the evidence available does not establish a new, discrete FPI shock at the opening bell today.
Asian Tech Weakness and Middle East Tensions Offset by Falling Crude Prices
Asian equities traded lower as concerns about the cost and profitability of artificial-intelligence infrastructure investments weighed on technology stocks. Japan’s Nikkei fell approximately 1.2%, South Korea’s market declined 0.4%, and the broader MSCI Asia-Pacific index excluding Japan fell 0.6%. Weak regional markets can make Indian investors more cautious about the sustainability of recent gains, increasing demand for protective option positions. However, US equity futures were higher in the Asian morning, limiting the extent of the negative global signal.
Brent crude fell to approximately $108.06 a barrel during Monday’s early trading, down around 1.64%, while WTI fell to approximately $100.88. The declines followed Friday’s rise to the highest Brent price since May. India is a major oil importer, and lower crude prices can ease concerns about the import bill, current-account balance, inflation and the outlook for interest rates.
However, Brent remained above $108 a barrel, so the decline did not remove the risk of an energy-driven inflation shock. The fall in crude was a potentially volatility-reducing factor, helping explain why India VIX rose only modestly despite negative global and domestic headlines.
Geopolitical uncertainty remained an upward risk to volatility expectations. Reports noted that Iran had said another tanker struck a mine in the Strait of Hormuz, while concerns about shipping disruption continued to affect oil-market sentiment.
The reported tanker incident occurred on 18 October, so it was not a new incident on 19 October, but its continuing market impact and coverage on Monday were relevant to the opening. Renewed shipping disruption could push oil prices higher again, increasing inflation and currency concerns in India and raising demand for index hedges.
Rupee Concerns and US Policy Uncertainty Shape the Volatility Calculus
The rupee’s recent recovery, Reserve Bank of India measures to support the currency, elevated oil prices and foreign portfolio flows were important considerations for Indian financial markets. The rupee had closed at ₹94.96 per US dollar on Friday. A weaker rupee can increase imported inflation and pressure companies with foreign-currency costs, while higher expected interest rates can affect equity valuations, borrowing costs and risk appetite. Uncertainty about RBI policy and capital flows can increase the premium traders require to hold short-dated options. However, this was a continuing macroeconomic concern rather than a confirmed new policy announcement on Monday.
Another development reported on Monday was the easing of crude prices following the US administration’s decision to waive certain Russia-related sanctions and tariffs. Uncertainty remained over the precise implications of the policy change. This was not a new policy decision first announced during the Indian opening session: the underlying decision dated from Friday. The relevant event today was the market’s reassessment of its possible effect on energy supply and prices. Expectations of additional Russian energy supply could reduce oil-price pressure, but uncertainty about the policy’s final implementation limited the confidence investors could place in that relief.
Technical Levels and Seasonality Suggest Caution Rather Than Panic
The technical rating for India VIX on the daily timeframe stood at Neutral. Pivot levels for the day, calculated based on the price range of the previous trading day, placed the classic pivot point at 13.79, with resistance at 14.78, 15.51 and 16.50, and support at 13.06, 12.07 and 11.34. The Fibonacci pivot point was also 13.79, with resistance at 14.44, 14.85 and 15.51, and support at 13.13, 12.72 and 12.07. The Camarilla pivot point was 13.79, with resistance at 14.22, 14.38 and 14.53, and support at 13.90, 13.74 and 13.59.
Seasonality analysis showed that 9 out of 18 years India VIX has given positive returns in October. The maximum positive change in October was 26.73% in 2020, while the average positive change was 11.48%. The maximum negative change was -30.99% in 2013, with an average negative change of -13.66%. The average change in October across the period was -1.09%. Year-to-date, India VIX has returned 53.27%, reflecting elevated uncertainty over the course of 2026.
A move from 14.06 to 14.32 is an increase of 0.26 volatility-index points, or approximately 1.85% relative to the starting level. It does not mean the Nifty is expected to fall by 1.85%. A VIX level of 14.32 corresponds to an annualised volatility estimate of 14.32%, translating to around 0.90% for a one-trading-day horizon, or approximately 1.68% over 30 calendar days, under a simplified square-root-of-time approximation.
Traders should monitor whether India VIX continues rising alongside Nifty weakness and increasing put premiums, or whether it retreats as crude prices ease and domestic indices recover. The intraday relationship between the volatility gauge, option-chain activity and benchmark movements will help distinguish a lasting volatility repricing from temporary opening-session hedge demand. Watching pivot levels of 13.79 and 14.78 alongside crude price direction and bank-sector earnings reaction provides a clearer picture of evolving market uncertainty.
Disclaimer
The information shared here is intended solely for informational and educational purposes and does not constitute investment recommendations. While we practice strict due diligence in curating daily market data, readers must perform independent research before trading. To flag any real-time data discrepancies or content concerns, please write to us at content@hdfcsec.com.
 Join Us
 Add as preferred source on Google


More Markets News










2 min read
Open Free Demat Account
Open Free Demat Account












Invest Anytime, Anywhere


By signing up I certify terms, conditions & privacy policy