Nifty 50
- Mahindra & Mahindra₹3,239111.50 (3.57%)
- Hindalco Industries₹900.25-37.60 (-4.01%)
- Titan Company₹4,947.20112.60 (2.33%)
- Shriram Finance₹935.80-28.20 (-2.93%)
- TCS₹2,549.1053.40 (2.14%)
- Asian Paints₹2,460.30-63.50 (-2.52%)
- Bharti Airtel₹2,095.9039.00 (1.90%)
- Bajaj Finance₹1,043.25-26.75 (-2.50%)
- HCL Technologies₹1,455.7025.20 (1.76%)
- Power Grid Corp₹255.10-6.05 (-2.32%)
- Infosys₹1,183.6016.20 (1.39%)
- JSW Steel₹1,327.10-28.50 (-2.10%)
- HDFC Bank₹769.209.20 (1.21%)
- NTPC₹311-5.70 (-1.80%)
- Apollo Hospitals₹8,456.5085.50 (1.02%)
- Bharat Electronics₹388.30-6.80 (-1.72%)
- Sun Pharmaceutical₹1,843.6014.60 (0.80%)
- Tata Steel₹179.25-2.75 (-1.51%)
- Tech Mahindra₹1,837.1014.40 (0.79%)
- Adani Enterprises₹2,696.30-37.00 (-1.35%)

- Offerings
- Tools & Platforms
Tools & Calculators
- Open API
- Calculators
- SIP Calculator
- CAGR Calculator
- Compound Interest Calculator
- FD Calculator
- RD Calculator
- EPF Calculator
- Retirement Calculator
- HDFC SIP Calculator
- Mutual Fund Return Calculator
- Lumpsum Calculator
- Step Up SIP Calculator
- ETF SIP Calculator
- Brokerage Calculator
- Equity Margin Calculator
- SWP Calculator
- EMI Calculator
- MTF Calculator
- Margin Pledge Calculator
- Algo Strategy
- Markets
Stocks
F&O
Mutual Funds
- More
Nasdaq Plunges 5.5% as AI Selloff Erases Post-Election Rally, Dow Drops 1,833 Points
Authored By HDFC SKY | Published at: Nov 6, 2026 08:59 AM IST
Open Free Demat Account
Mumbai, 6 November 2026: US equities suffered a severe closing-session selloff on Thursday, with the Nasdaq Composite entering correction territory and the Dow Jones Industrial Average surrendering its entire post-election rally, as a sweeping liquidation in artificial-intelligence and semiconductor shares overwhelmed the broader market.
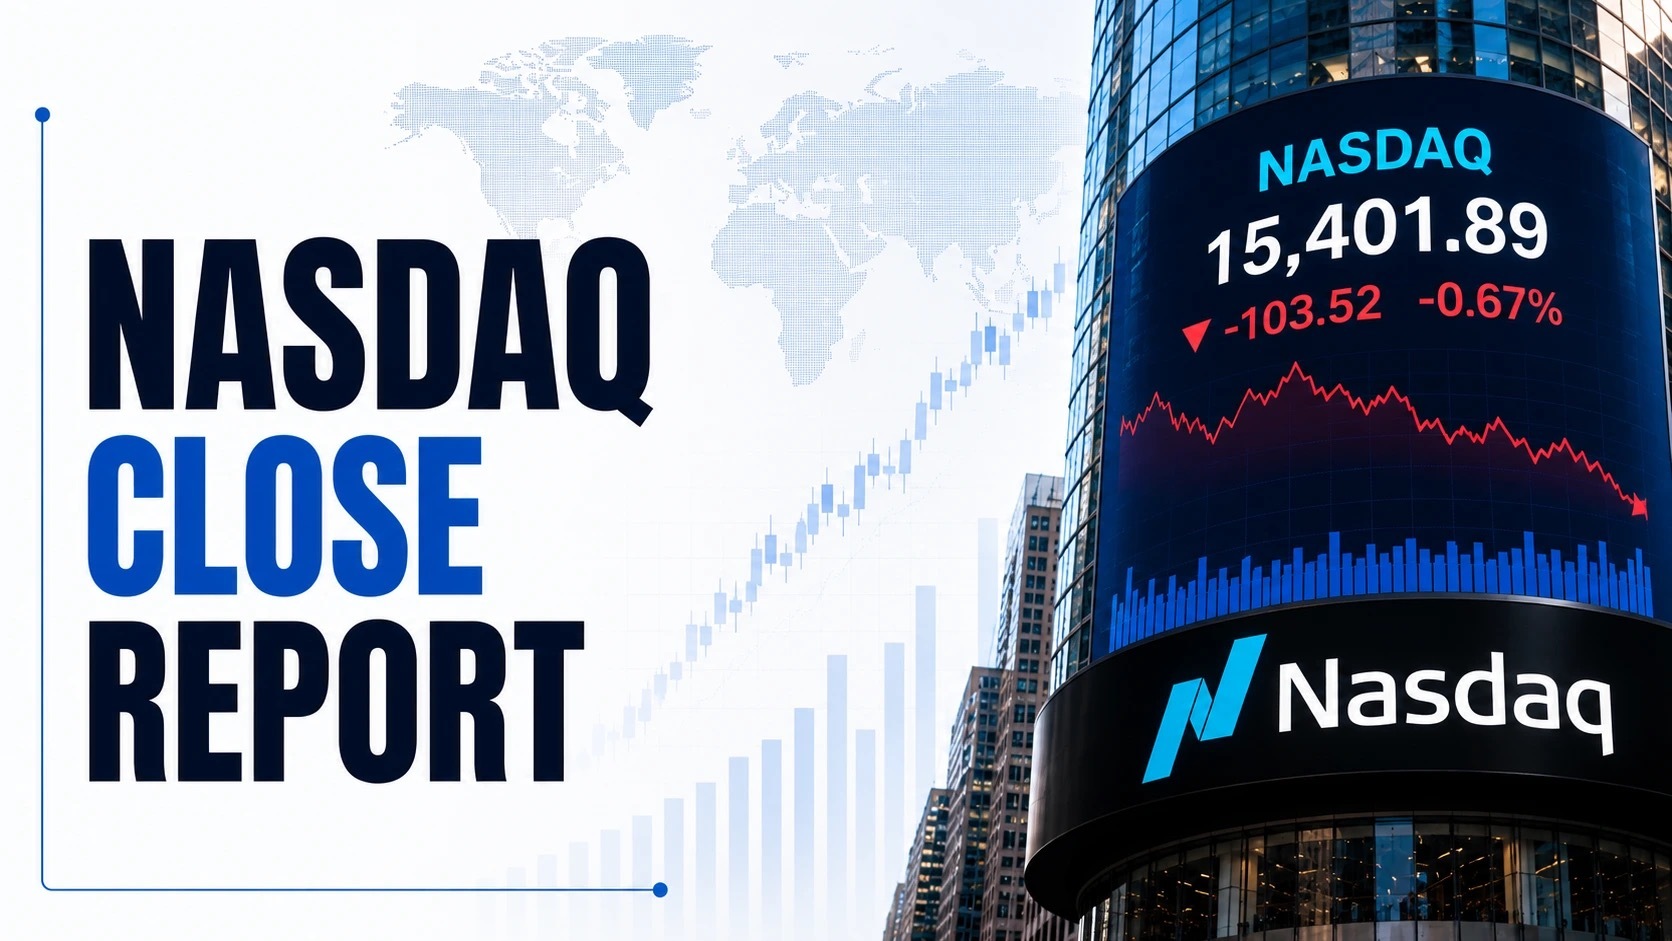
The blue-chip Dow closed at 51,523.06, down 1,833.06 points or 3.44%, while the S&P 500 fell 4.36% to 7,353.73. The technology-heavy Nasdaq Composite plunged 5.52% to 24,315.00, closing more than 10% below its October record and marking its worst single-day decline since the COVID-19 pandemic shock of March 2020.
The small-cap Russell 2000 dropped 4.28% to 2,734.65, also entering correction territory. The session’s rout followed a decisive Democratic sweep in the US midterm elections, which investors interpreted as a potential brake on data-centre construction and AI infrastructure spending, triggering a violent unwind of the year’s most crowded momentum trades.

Dow Jones Drops 1,833 Points as AI Infrastructure Fears Hammer Blue-Chip Constituents
The Dow Jones Industrial Average opened at 53,679.01 and closed at 51,523.06, losing 1,833.06 points or 3.44%. The index touched an intraday high of 53,710.61 and a low of 51,486.82. The decline was led by Nvidia, which slumped 9.51% and alone erased roughly $374 billion in market value, according to the reference data. Goldman Sachs fell 6.36%, Caterpillar dropped 6.64%, and Cisco Systems declined 7.49%. Microsoft lost 4.01%, JPMorgan Chase fell 4.14%, and UnitedHealth Group slipped 3.69%. Among the few relative outperformers, Procter & Gamble eased just 0.05%, Coca-Cola lost 0.27%, and McDonald’s declined 0.78%. The session followed the prior day’s 1,575-point rally, which had been the Dow’s strongest post-midterm gain since 1982, and the reversal was sharp enough to rank as the index’s worst second session after a midterm election in data going back to 1896.
The trigger for the blue-chip carnage was not a deterioration in corporate fundamentals but a frantic repositioning by institutional investors. The Democratic victories in Texas, Ohio, and Georgia, where incoming governors have advocated data-centre moratoriums or tighter scrutiny, raised concerns that the physical buildout underpinning AI demand could slow. Nvidia, the most valuable company in the world until this week, bore the brunt of the selling, while industrial and financial heavyweights tied to the broader economy also retreated as the tech-led selling spread into other sectors. The Dow’s close below 52,000 marked a 3.6% decline from its record closing high of 54,349 set in early August, leaving the index up just 8.43% year-to-date.
S&P 500 Sinks 4.36% as All Eleven Sectors Turn Negative During Closing Trade
The S&P 500 opened at 7,678.72 and ended at 7,353.73, losing 334.89 points or 4.36%. During the session, the index reached a high of 7,681.29 and a low of 7,350.35. The benchmark shed more than $2 trillion in market value by midmorning and finished with 419 decliners against 84 gainers. The technology sector was the epicentre of the damage, with SanDisk collapsing 22.21%, Micron Technology falling 16.98%, Advanced Micro Devices dropping 17.35%, and Broadcom losing 10.39%. Oracle declined 7.86%, Palantir Technologies fell 10.18%, and CrowdStrike Holdings dropped 10.42%. Outside technology, Caterpillar fell 6.64%, GE Aerospace lost 4.99%, and JPMorgan Chase slipped 4.14%.
Despite the broad rout, a handful of constituents posted notable gains. AppLovin Corporation surged 29.16%, EPAM Systems jumped 18.11%, Unity Software rallied 13.75%, and Airbnb gained 6.25%, though these moves were insufficient to offset the aggregate losses. The index’s closing performance came as the Democratic sweep reshaped expectations for AI-related capital expenditure, with investors fearing that peak spending may be behind the market. The S&P 500’s decline was its worst single-day drop since April 2025, when President Trump’s “liberation day” tariff announcements convulsed global markets, and the index closed just under 1% above its 200-day moving average, a technical threshold it has not breached since April.
Nasdaq Composite Plunges 5.52% as Technology and Growth Shares Lead Market Retreat
The Nasdaq Composite opened at 25,558.11 and closed at 24,315.00, marking a loss of 1,421.52 points or 5.52%. Its intraday high stood at 25,559.03, while the low was 24,262.14. The technology-heavy benchmark erased its entire post-election rally within six minutes of the opening bell and closed in correction territory, 10% below its record close set in October. Nvidia fell 9.49%, Microsoft lost 3.55%, Apple slipped 1.72%, Amazon.com declined 2.73%, Meta Platforms dropped 4.53%, and Alphabet fell 2.57%. Tesla tumbled 10.97%, extending a two-day wipeout that has erased roughly $221 billion in market value. Broadcom lost 10.39%, Intel dropped 11.19%, and Applied Materials plunged 13.91%. Lam Research fell 15.48%, KLA Corporation lost 13.38%, and Marvell Technology dropped 16.77%.
Among the Nasdaq-100’s few gainers, AppLovin surged 29.16%, Airbnb rose 6.25%, PDD Holdings gained 2.19%, and Costco Wholesale added 1.72%. The index’s close below its 200-day moving average for the first time since April signalled a potential longer-term downtrend, and the session’s decline was the Nasdaq’s worst since March 2020. The technology-heavy benchmark responded to a confluence of catalysts: the Democratic sweep, a delay in China’s approval of Nvidia’s H200 chip imports, and a soft profit outlook from Qualcomm, which fell 10.08% despite beating earnings estimates. The Nasdaq-100, which tracks the largest non-financial companies, closed 4.46% lower at 27,168.79, down 13.3% from its early October high.
Also Read: What Is the New York Stock Exchange (NYSE)?
Russell 2000 Falls 4.28% as Smaller Stocks Enter Correction on Data-Centre Concerns
The Russell 2000 opened at 2,855.25 and closed at 2,734.65, losing 122.30 points or 4.28%. It recorded an intraday high of 2,855.25 and a low of 2,723.93, closing in correction territory more than 10% below its recent peak. Movements among smaller-cap companies reflected the same forces weighing on the broader market, with Astera Labs down 19.46%, Applied Optoelectronics falling 24.08%, SanDisk dropping 21.84%, and Lumentum Holdings losing 19.27%. Credo Technology fell 17.72%, Riot Platforms dropped 4.68%, and Wulf declined 14.54%. Among the few gainers, Sezzle rose 12.66%, Appian gained 8.45%, and Groupon added 5.07%.
The small-cap benchmark’s performance was shaped by the same AI infrastructure concerns that battered larger technology names, but the Russell 2000’s greater sensitivity to domestic economic conditions and financing costs amplified the decline. The index had closed the prior session at 2,856.95, up 1.58%, and Thursday’s reversal erased that gain entirely. The Russell 2000’s close below 2,750 left it up 11.15% year-to-date but firmly in correction territory, reflecting the broad-based nature of the selloff rather than idiosyncratic small-cap weakness.
S&P 100 Drops 4.20% as Large-Cap Shares Track AI Infrastructure Unwind
The S&P 100 opened at 3,788.22 and finished at 3,635.56, recording a loss of 159.51 points or 4.20%. The index traded between 3,790.50 and 3,622.95 during the session. Movements in major large-cap constituents mirrored the broader market’s retreat, with Nvidia down 9.51%, Microsoft off 4.01%, Broadcom lower by 10.39%, Amazon down 2.79%, and Meta Platforms falling 4.39%. Tesla lost 10.97%, JPMorgan Chase declined 4.14%, and Goldman Sachs dropped 6.36%. Apple outperformed on a relative basis, losing just 1.72%, while Costco gained 1.72% and PepsiCo added 0.27%.
The large-cap benchmark’s decline reflected the same trigger as the broader market: the Democratic sweep and its perceived implications for data-centre regulation and AI capital spending. The S&P 100’s close at 3,635.56 marked a 4.2% single-day decline and left the index 7.1% below its 52-week high of 3,914.19, underscoring the severity of the reversal in the market’s largest and most liquid names.
Dow Composite Falls 3.18% as Transport and Utility Averages Diverge Sharply
The Dow Jones Composite Average opened at 16,876.31 and closed at 16,245.09, losing 532.85 points or 3.18%, after moving between 16,876.31 and 16,208.41. The Dow Jones Transportation Average ended at 20,088.97, compared with an opening level of 20,909.16, representing a 3.56% decline or 742.01 points. The Dow Jones Utility Average closed at 1,105.57, changing 0.73% from its opening level of 1,124.17, a loss of 8.12 points.
Movements in relevant constituents reflected the divergence between cyclical and defensive sectors: transport names such as Caterpillar and FedEx faced selling pressure tied to growth concerns, while utilities found relative support from their defensive characteristics and the pullback in Treasury yields. The composite average’s close below 16,300 marked a 3.2% single-day decline, with the transportation average’s 3.56% drop outpacing the utility average’s 0.73% decline, illustrating the market’s rotation away from economically sensitive shares.
Philadelphia Semiconductor Index Plunges 12.25% as Chip Stocks Suffer Historic Rout
The Philadelphia Semiconductor Index (SOX) opened at 9,806.31 and closed at 9,011.14, losing 1,257.52 points or 12.25%. Its intraday high was 9,838.13, while the low was 8,997.39. Semiconductor-related constituents suffered double-digit declines across the board: Micron Technology fell 17.23%, Advanced Micro Devices dropped 17.35%, Applied Materials declined 13.91%, Lam Research plunged 15.48%, KLA Corporation lost 13.38%, Marvell Technology fell 16.77%, and Broadcom dropped 10.39%.
Nvidia lost 9.49%, Intel fell 11.19%, Texas Instruments declined 10.75%, and Qualcomm dropped 9.89%. The SOX’s close below 9,100 left the index 38% below its October intraday high and deep in bear-market territory, with the single-day drop ranking as the second-largest in the index’s history this century, surpassed only by the March 2020 pandemic crash.
Also Read: How to invest in US stocks
NYSE Composite Changes -2.75% as Broader Shares Track Tech-Led Selling Pressure
The NYSE Composite Index opened at 24,771.64 and closed at 24,008.03, recording a loss of 678.09 points or 2.75%. The index traded between 24,771.64 and 23,942.75 during the session. Movements across relevant market segments reflected the broad nature of the selloff, with technology and semiconductor shares leading the decline while defensive sectors such as consumer staples and utilities provided partial offset.
International Business Machines fell 2.98%, Salesforce dropped 4.01%, and Cisco Systems lost 7.49%. Financial names also weakened, with JPMorgan Chase down 4.14%, Morgan Stanley falling 5.94%, and Citigroup dropping 5.04%. The NYSE Composite’s close below 24,100 marked a 2.75% daily decline, less severe than the Nasdaq’s 5.52% drop but still reflecting the contagion of technology-led selling into the broader market.
S&P MidCap 400 and SmallCap 600 Slide 3.85% and 3.75% on Growth Concerns
The S&P MidCap 400 opened at 3,723.17 and closed at 3,582.28, moving 143.42 points or 3.85% lower, with an intraday range of 3,574.28 to 3,729.88. The S&P SmallCap 600 opened at 1,736.50 and ended at 1,673.11, losing 65.15 points or 3.75%, after trading between 1,667.14 and 1,744.04. The two benchmarks reflected movements among mid- and small-cap shares as the AI infrastructure selloff and the Democratic sweep’s regulatory implications weighed on growth expectations across the capitalisation spectrum.
Within the mid-cap index, Curtiss-Wright fell 14.45%, Moog dropped 5.30%, and Woodward lost 2.88%, while JBT Marel gained 0.44% and Matson added 1.33%. The small-cap index’s decline was amplified by weakness in Astera Labs and Applied Optoelectronics, though both benchmarks closed well above their intraday lows, suggesting some stabilisation in the final hour of trading.
VIX Surges 64.12% to 27.26 as Volatility Spikes on AI-Led Market Turmoil
The CBOE Volatility Index (VIX) changed 64.12% to 27.26, compared with its previous close of 16.61. The index measures expected volatility in the S&P 500 over the coming 30 days and briefly touched 28.09 during the session, its highest level since March 31. The VIX’s movement coincided with the AI-led selloff and the broad deleveraging across equity markets.
The CBOE Nasdaq Volatility Index (VXN) also rose sharply, reflecting the outsized moves in technology shares, while the CBOE S&P 500 3-Month Volatility Index (VIX3M) moved higher as investors priced in sustained uncertainty around data-centre regulation and AI capital spending. The VIX’s close above 27 marked the largest single-day jump since April 2025’s tariff shock and underscored the speed with which volatility returned to a market that had been trading near record highs just weeks earlier.
S&P 500 Sectors Fall Broadly as Technology Slumps 6.6% and Defensives Outperform
Performance across the 11 S&P 500 sectors was broadly negative, with all groups closing lower. Information Technology recorded the weakest move at -6.6%, followed by Consumer Discretionary at -4.1% and Industrials at -4.0%. Materials declined 2.5%, Financials fell 2.1%, Real Estate lost 1.6%, Health Care dropped 1.1%, and Communication Services and Utilities each slipped 0.6%. Consumer Staples held up best, declining just 0.2%, while Energy fell 0.4%.
The sector movements followed the technology-led selloff and the rotation into defensive shares, with consumer staples and utilities attracting haven demand as investors sought exposure to earnings streams less tied to AI capital spending. The breadth of the decline—417 of the S&P 500’s 503 members closed lower—reflected the systemic nature of the repositioning rather than idiosyncratic sector weakness.
Also Read: US Stock Market Timings
Magnificent Seven Lose Nearly $900 Billion as AI Leaders Bear Brunt of Selling
Among the Magnificent Seven, Nvidia moved -9.49%, Microsoft changed -3.55%, Apple recorded -1.72%, Amazon.com fell 2.73%, Alphabet declined 2.57%, Meta Platforms dropped 4.53%, and Tesla tumbled 10.97%. The seven companies lost close to $900 billion in aggregate market value heading into the final hour of trading, with Nvidia alone accounting for roughly $374 billion of the decline, Tesla for $161 billion, and Microsoft for $117 billion. Their daily movements contributed to the performance of major US equity benchmarks and underscored the concentration risk that had built up in the market’s largest technology names. Apple, which had overtaken Nvidia as the world’s most valuable company earlier in the week, was the relative outperformer within the group, while Tesla’s decline extended a two-day rout tied to concerns about regulatory hurdles in Texas and the broader unwinding of the so-called Trump trade.
Semiconductor, Financial and Energy Stocks Show Mixed Daily Moves
Semiconductor stocks were sharply lower, with the Philadelphia Semiconductor Index falling 12.25%. Financial stocks recorded broad declines, with JPMorgan Chase down 4.14%, Goldman Sachs falling 6.36%, Morgan Stanley dropping 5.94%, and Citigroup losing 5.04%.
Energy stocks moved modestly lower even as crude oil prices rose, with Exxon Mobil down 2.35%, Chevron falling 1.77%, and ConocoPhillips slipping 1.06%. AI and growth stocks were mixed, with Palantir Technologies down 10.18%, CrowdStrike Holdings falling 10.42%, and Oracle dropping 7.86%, while AppLovin surged 29.16% and Airbnb gained 6.25%.
The divergence within growth shares reflected company-specific earnings reactions rather than a uniform sector move, but the aggregate direction remained decisively negative as the AI infrastructure trade unwound.
Economic Data Shows Jobless Claims at 189,000 as Productivity Surges 3.6%
The latest economic data showed initial jobless claims at 189,000 for the week ended October 31, down 6,000 from the prior period and below the consensus estimate of 197,000. The total tied for the lowest since July and was near levels last seen in September 1969. Continuing claims rose 23,000 to 1.72 million. Nonfarm business sector productivity surged 3.6% in the third quarter, up from 2.1% in the second quarter and well ahead of the 2.9% consensus estimate.
Unit labour costs contracted 0.7%, while the labour share of output slipped to 53%, the lowest in a data series dating back to 1947. The Challenger report showed 43,994 job cuts announced in October, down 71% from a year earlier and the lowest level since 2023. The releases provided the latest information on employment, productivity, and labour costs during a session dominated by equity-market repositioning rather than macroeconomic data.
Federal Reserve Rate Expectations Shift as Treasury Yields Fall on Haven Demand
The Federal Reserve remained a key focus as markets assessed the implications of the Democratic sweep for monetary policy. The political shift effectively blocks President Trump’s campaign to reshape the Fed, with Democrats now positioned to approve or deny any new nominees to the Board of Governors. The latest development showed that traders scaled back expectations for rate increases, with a single quarter-point raise no longer fully priced in until March 2027, compared with bets on a January move just a day earlier.
The 2-year US Treasury yield stood at 4.50%, down 8 basis points, while the 5-year yield was 4.62%. The 10-year Treasury yield stood at 4.84%, down 5 basis points, and the 30-year yield was 5.25%, down 3 basis points. The yield curve steepened modestly as short-term yields fell more than long-term yields, reflecting the market’s reassessment of the Fed’s tightening path amid the equity selloff and the political shift in Washington.
Also Read: What Are Fractional Shares?
Crude Oil Rises 2.2% to $90.03 as Gold Gains 1.3% on Haven Demand
Brent crude traded at $96.76, changing 2.3%, while WTI crude stood at $90.03, moving 2.2%. Gold traded at $4,126 an ounce, changing 1.3%, while silver moved 0.6% to $52.61. Copper changed 0.9% to $5.12 per pound, and natural gas moved 1.8% to $4.35 per million British thermal units.
The commodity moves followed a rebound in oil prices after four days of declines, as uncertainty grew over whether President Trump would pursue a deal with Iran to end the war in the Middle East. Gold and silver extended their post-election rally, supported by a weaker dollar and lower Treasury yields, with gold on pace for its best week since August. The commodity complex reflected the day’s broader market conditions: haven demand for precious metals, supply uncertainty in energy, and a modest recovery in industrial metals despite the equity selloff.
Dollar and Major Currencies Move Against Rate Expectations and Political Shift
The US Dollar Index (DXY) moved -0.4% to 98.75. EUR/USD stood at 1.1620, USD/JPY traded at 151.80, and GBP/USD was at 1.3482. Where relevant, USD/CNY traded at 7.1180. Currency movements followed the shift in rate expectations and the political developments in Washington, with the dollar weakening against the euro and sterling as traders reassessed the Fed’s tightening path.
The dollar’s decline was modest relative to the scale of the equity selloff, reflecting the currency market’s assessment that the Fed’s policy trajectory, while uncertain, remained broadly restrictive. The Bank of England’s decision to raise rates by a quarter point to 4% also influenced sterling, which held near 1.3482 against the dollar despite the broader market turmoil.
The closing session was shaped by the Democratic midterm sweep and its perceived implications for AI data-centre spending, alongside a sharp unwind of crowded technology positions. The Dow finished at 51,523.06, the S&P 500 at 7,353.73, and the Nasdaq at 24,315.00, with the VIX at 27.26 and Treasury yields lower. These figures provide a factual summary of the session’s key market developments.
Source
- https://www.nasdaq.com/
- spglobal.com/spdji/en/indices/equity/sp-500/
- https://www.dowjones.com/
- https://www.spglobal.com/spdji/en/indices/equity/dow-jones-industrial-average/
- https://www.spglobal.com/spdji/en/indices/equity/sp-500/
- https://www.nasdaq.com/market-activity/index/comp
- https://www.nasdaq.com/market-activity/quotes/nasdaq-ndx-index
- https://www.spglobal.com/spdji/en/indices/equity/sp-100/
- https://www.lseg.com/en/ftse-russell/indices/russell-us
- https://www.nyse.com/index
- https://www.nyse.com/index
- https://www.spglobal.com/spdji/en/indices/equity/dow-jones-transportation-average/
- https://www.spglobal.com/spdji/en/indices/equity/dow-jones-utility-average/
- https://www.spglobal.com/spdji/en/indices/equity/dow-jones-composite-average/
- https://www.nasdaq.com/market-activity/index/sox
- https://www.cboe.com/tradable_products/vix/
Disclaimer
The information shared here is intended solely for informational and educational purposes and does not constitute investment recommendations. While we practice strict due diligence in curating daily market data, readers must perform independent research before trading. To flag any real-time data discrepancies or content concerns, please write to us at content@hdfcsec.com.
 Join Us
 Add as preferred source on Google


More International News







Open Free Demat Account












Invest Anytime, Anywhere


By signing up I certify terms, conditions & privacy policy