Nifty 50
- Eternal₹317.4012.95 (4.25%)
- Shriram Finance₹865-35.90 (-3.98%)
- Apollo Hospitals₹7,730125.50 (1.65%)
- Adani Enterprises₹2,477-73.00 (-2.86%)
- ONGC₹227.502.50 (1.11%)
- JSW Steel₹1,185.50-34.50 (-2.83%)
- Asian Paints₹2,30722.20 (0.97%)
- Jio Financial ₹205.03-5.77 (-2.74%)
- TCS₹2,53023.10 (0.92%)
- Tata Steel₹167.67-4.66 (-2.70%)
- UltraTech Cement₹11,05092.00 (0.84%)
- Adani Ports₹1,702.70-47.30 (-2.70%)
- Maruti Suzuki₹11,23060.00 (0.54%)
- Tech Mahindra₹1,790-39.10 (-2.14%)
- Cipla₹1,3387.10 (0.53%)
- Tata Motors PV₹264.60-5.40 (-2.00%)
- Reliance Industries₹1,1905.50 (0.46%)
- Hindalco Industries₹869.85-15.75 (-1.78%)
- Axis Bank₹1,217.505.50 (0.45%)
- Trent₹2,727.50-48.30 (-1.74%)

- Offerings
- Tools & Platforms
Tools & Calculators
- Open API
- Calculators
- SIP Calculator
- CAGR Calculator
- Compound Interest Calculator
- FD Calculator
- RD Calculator
- EPF Calculator
- Retirement Calculator
- HDFC SIP Calculator
- Mutual Fund Return Calculator
- Lumpsum Calculator
- Step Up SIP Calculator
- ETF SIP Calculator
- Brokerage Calculator
- Equity Margin Calculator
- SWP Calculator
- EMI Calculator
- MTF Calculator
- Margin Pledge Calculator
- Algo Strategy
- Markets
Stocks
F&O
Mutual Funds
- More
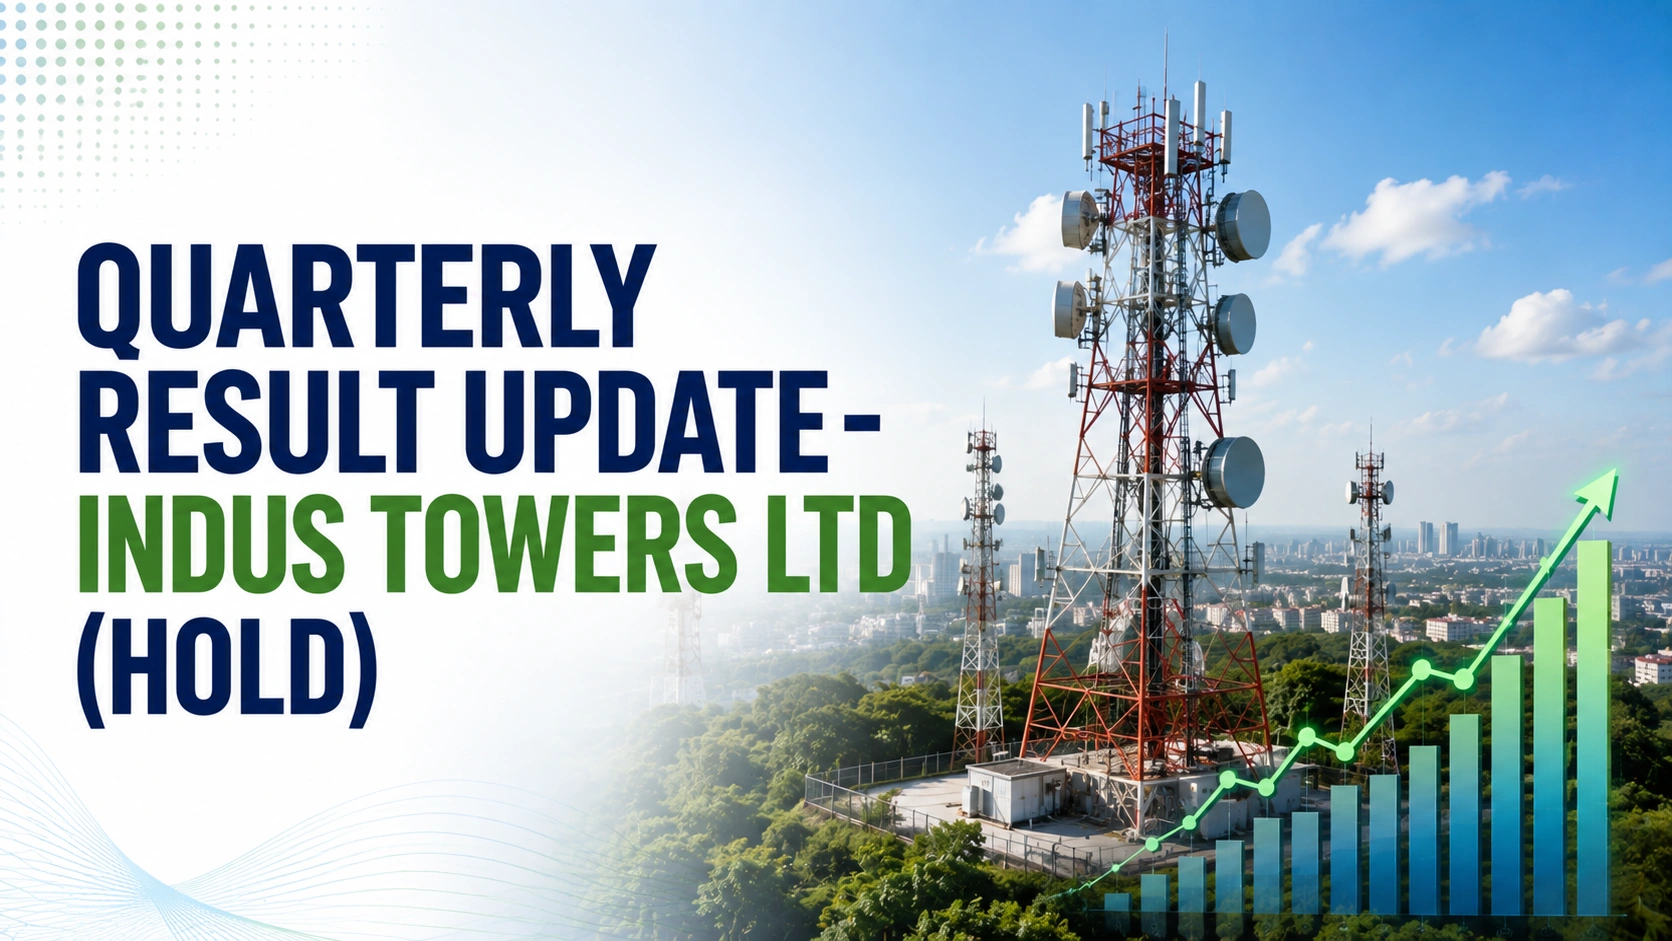
Quarterly Result Update- Indus Towers Ltd (Hold)
Authored By Prime Research | Published at: Aug 7, 2026 09:35 AM IST
Open Free Demat Account
Open Free Demat Account
Muted performance in Q1FY27, however continue to scale its digital infrastructure
- Indus Towers numbers were in line with estimates in Q1FY27. Q1 had early-quarter disruption due to tower manufacturing impact from LPG shortage linked to the West Asia conflict. Its con27, , and the net profit decreased 1% on a QoQ basis.
- Indus solidated revenue grew 4.6% YoY to Rs 8431 crore, driven by customer network expansion. The company’s EBITDA stood at Rs 4,521 crore, and the EBITDA margin slipped to 53.6% in Q1FYTowers has the widest coverage in India, spanning over 2,67,611 towers and 4,32,000 co-locations, with a nationwide presence across all 28 telecom circles. The company added 3,097 macro towers and 4,236 co-locations, resulting in YoY growth of 6.3% and 5.1% in the tower and co-location bases, respectively, marking a strong quarterly expansion driven by customer network rollouts. Tenancy sharing ratio stood at 1.62x (stable QoQ). The company expects a robust tower rollout over the next 4-6 quarters, based on strong order-book visibility. The company expects both towers and tenancies to grow, and these towers will continue to have the option to accommodate a second tenant.
- Indus Towers will begin its business operations in African countries in partnership with its existing partner, Bharti Airtel, which has a strong presence in the region and holds the third-largest market share. Combined with growth potential from emerging opportunities in Africa, its robust financial position, and an anchor customer relationship with Bharti Airtel, rollouts will begin next quarter, with financial stability expected as operations mature. Strategic international expansion is underway with licensed operations beginning in Nigeria, Uganda, and Zambia.
- The coimpacted by lower revenue growth and higher power and fuel costs. The company’s net profit (adj) was up 1% YoY to Rs 1746 crore in Q1FY27. Revenue/EBITDA increased 4.1%/1.3%, respectivelympany has decided to explore business opportunities in the Electric Vehicle (EV) charging infrastructure sector. The company is well-positioned to contribute to the EV charging infrastructure sector by leveraging its expertise in managing and providing space, power, and operations and maintenance (O&M) for seamless operation and efficiency.
- The outlook for the tower infrastructure sector is positive and robust, driven by continued global 5G expansion, rising data consumption, and government initiatives to drive digital transformation. Increased network densification with more towers and small cells, the strategic deployment of AI for predictive maintenance, and the expansion of services including fibre, data centres, and IoT infrastructure could strengthen the tower infrastructure going forward.

Concall: Key takeaways
- The company expects strong performance for the next three to four quarters and described as a mix of network expansion plus movement of tenancies.
- Heavy monsoon seasons create seasonal margin pressures by causing power grid outages, which require expensive diesel generator back-ups. Q2 execution can be impacted by monsoon/water-logging in some states (affecting rollout pace).
- The company is focusing on structural improvements across site rental, supply chain, infra costs, partner management, enabled by “data intelligence and standardised operating frameworks.”
- Indus claims continued share gains vs peers, stating it is seeing “significantly larger tenancy growth than our peers” driven by “strong execution, service reliability, and technology-led operations.”
- Lithium-ion battery program called “ambitious”; Q1 constrained by battery supply disruptions from geopolitical disturbances, expected to improve in coming quarters.
- Expanded offerings with “integrated IBS and built-to-suit hybrid solutions” targeting large residential and commercial complexes, plus “Metro and railway stations, tunnels, highways, and marquee government establishments.”
- Supply chain disruptions impacted tower manufacturing in the initial part of the quarter due to geopolitical issues, although these have been resolved.
Valuation & Recommendation
Indus Towers Ltd provides tower and related passive infrastructure to telecom service providers on a non-discriminatory basis under long-term service contracts. The company is committed to building robust, sustainable infrastructure to ensure seamless connectivity. Indus expects strong revenue growth from 5G rollouts and higher tenancy ratios. Emerging technologies such as 5G, artificial intelligence, robotics, and the internet of things will provide an opportunity for the company to expand its offerings. Attractive tower economics, supported by high tenancy levels and Airtel Africa’s anchor presence, drive profitability, while partial dollar-linked rentals mitigate currency risk.
We had issued a Pick of the Week report on Indus Towers Ltd on March 01, 2026 and recommended to buy in the band of Rs 425-435 and add on dips in the band of Rs 378-386 for a base case fair value of Rs 471 and the bull case fair value of Rs 500 over the next four quarters. The stock achieved its base case target on March 12, 2026. We have an open call on the stock and recommend a “Hold” rating.
Risks & Concerns
- Susceptible to regulatory and technological changes.
- New technology could necessitate fresh investments or an overhaul of the existing networks.
- Investment in the Telecom industry is capital-intensive in nature.
- Margin pressure from fuel price hikes.
- Any substantial, debt-funded capex.
- Slower pace of 5G rollout and SIM consolidation.
Financial Summary
| Particulars (Rs Cr) | Q1FY27 | Q1FY26 | YoY-% | Q4FY26 | QoQ-% | FY24 | FY25 | FY26 | FY27E | FY28E |
|---|---|---|---|---|---|---|---|---|---|---|
| Total Operating Income | 8431 | 8058 | 4.6 | 8101 | 4.1 | 28,601 | 30,123 | 32,493 | 35,063 | 38,050 |
| EBITDA | 4521 | 4390 | 3.0 | 4424 | 2.2 | 14,557 | 20,845 | 17,813 | 18,592 | 20,519 |
| APAT | 1746 | 1737 | 0.5 | 1793 | -2.6 | 6,036 | 9,932 | 7,145 | 7,628 | 8,840 |
| Diluted EPS (Rs) | 6.6 | 6.6 | 0.5 | 6.8 | -2.6 | 22.4 | 37.3 | 27.1 | 28.9 | 33.5 |
| RoE (%) | – | – | – | – | – | 22.3 | 30.6 | 18.0 | 17.7 | 18.6 |
| P/E (x) | – | – | – | – | – | 17.1 | 10.3 | 14.2 | 13.3 | 11.4 |
| EV/EBITDA (x) | – | – | – | – | – | 8.4 | 5.7 | 6.5 | 6.3 | 5.7 |
Recommendation
| Reco | |
|---|---|
| Rating | Hold |
| Industry | Telecom Infra |
| LTP (Aug 06, 2026) | 383.3 |
| Bull case target | 500 |
| Time Horizon | 4 Quarters |
Stock Info
| Particular | Value |
|---|---|
| BSE Code | 534816 |
| NSE Code | INDUSTOWER |
| Bloomberg | INDUSTOW IN |
| Equity Capital (Rs Cr) | 2638.2 |
| Face Value (Rs) | 10.0 |
| Equity Share O/S (Cr) | 263.8 |
| Market Cap (Rs Cr) | 100,755 |
| Adj. Book Value (Rs) | 150.0 |
| Avg. 52 Wk Volumes | 8,042,370 |
| 52 Week High | 482.0 |
| 52 Week Low | 312.6 |
Share Holding Pattern (%) (Jun’26)
| Category | Holding (%) |
|---|---|
| Promoters | 51.3 |
| Institutions | 44.6 |
| Non-Institutions | 4.1 |
| Total | 100.0 |
Disclaimer
If you have any concerns, questions, or wish to point out any discrepancies in our content, please feel free to write to us at content@hdfcsec.com.
Please Note: The information shared is intended solely for informational purposes and does not make any investment recommendations
Disclaimer
At HDFC SKY*, we take utmost care and due diligence in curating and presenting news and market-related content. However, inadvertent errors or omissions may occasionally occur.
If you have any concerns, questions, or wish to point out any discrepancies in our content, please feel free to write to us at content@hdfcsec.com.
Please Note: The information shared is intended solely for informational purposes and does not make any investment recommendations.
HDFC SKY from HDFC Securities, one of most trusted trading platforms in India, has been recognized with the *Next-Gen Digi Content Awards 2025-26.
 Join Us
 Add as preferred source on Google


Open Free Demat Account
Open Free Demat Account
₹380










Invest Anytime, Anywhere


By signing up I certify terms, conditions & privacy policy