Nifty 50
- TCS₹2,108.6028.30 (1.36%)
- Adani Enterprises₹2,555.70-187.30 (-6.83%)
- HCL Technologies₹1,195.4010.40 (0.88%)
- ITC₹254.80-10.90 (-4.10%)
- Infosys₹999.257.25 (0.73%)
- Max Healthcare₹872.25-35.75 (-3.94%)
- Tech Mahindra₹1,500.609.50 (0.64%)
- Adani Ports₹1,682-68.10 (-3.89%)
- Titan Company₹4,404.1027.10 (0.62%)
- JSW Steel₹1,182.60-47.40 (-3.85%)
- Nestle₹1,330.906.90 (0.52%)
- SBI Life Insurance ₹1,661-65.10 (-3.77%)
- Axis Bank₹1,2485.50 (0.44%)
- Apollo Hospitals₹7,626.50-290.50 (-3.67%)
- Trent₹2,896.406.10 (0.21%)
- InterGlobe Aviation₹4,820.40-169.60 (-3.40%)
- HDFC Life Insurance ₹546.500.45 (0.08%)
- Dr. Reddy's Labs₹1,170.30-33.50 (-2.78%)
- Reliance Industries₹1,175.60-32.10 (-2.66%)

- Offerings
- Tools & Platforms
Tools & Calculators
- Open API
- Calculators
- SIP Calculator
- CAGR Calculator
- Compound Interest Calculator
- FD Calculator
- RD Calculator
- EPF Calculator
- Retirement Calculator
- HDFC SIP Calculator
- Mutual Fund Return Calculator
- Lumpsum Calculator
- Step Up SIP Calculator
- ETF SIP Calculator
- Brokerage Calculator
- Equity Margin Calculator
- SWP Calculator
- EMI Calculator
- MTF Calculator
- Margin Pledge Calculator
- Algo Strategy
- Markets
Stocks
F&O
Mutual Funds
- More
Decoding Options: Unleashing the Power of Sky's Analyze Feature
By Peter Cutinho | Updated at: Apr 4, 2025 11:32 AM IST

Open Free Demat Account
Open Free Demat Account
Position Analyzer a personalized trading assistant provides you with a comprehensive set of derivatives market data to help you make more informed trading decisions.
This includes real time insights on your open positions, understand options Greeks effortlessly, and visualize payoffs at a glance. With a user-friendly interface and a customized trade summary, it’s the ultimate tool for every level of options trader. Make precision trading a breeze with Sky’s Analyze feature.
How to Analyse F&O Positions?
To Analyze an open F&O positions in Sky, follow these steps:
Step 1 : Go to the Portfolio tab.
Step 2 : Tap on Positions section.
Step 3 : Click the Analyze button next to the position you want to analyze.
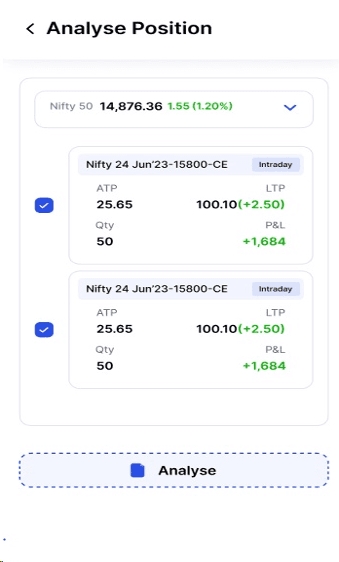
Features and Interpretation
After clicking on the Analyze button the user will be redirected to the new page where in all the position will be sorted based on the different underlying.
Step 4 : Select the Underline from the dropdown menu, which you want to Analyze.
Step 5 : Click the Analyze button and get the valuable insights on your open positions.
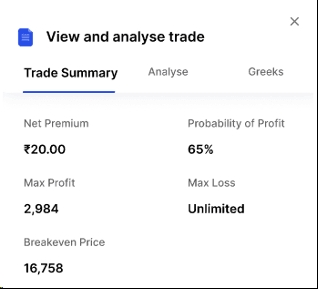
Once you click on the Analyze feature, you will get insights of Trade Summary, Analyse Pay-off graph and Greeks
Trade Summary
The trade summary provides a brief overview of the cumulative F&O position or strategy, including the maximum risk, maximum profit, breakeven point, and probability of profit. This information can be used to help you make informed trading decisions.
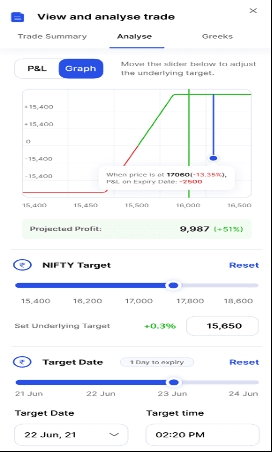
Analyze
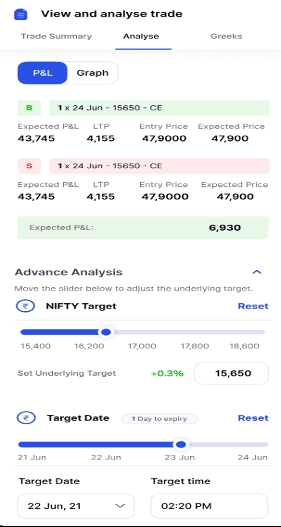
This window allows you to analyze the position cumulatively for all the legs selected. It shows the payoff P&L in data format and the payoff graph in graphical format.
To adjust the underlying target and date, move the slider as shown in the image. The P&L will be updated based on the target date and time selected.
Payoff Graph: This graph shows the profit or loss in graphical format with a defined range. When you move the slider, the profit or loss for the defined target and date will also be plotted on the graph in the form of a blue line.
Payoff P&L
: This table shows the profit or loss on the individual leg and also on the strategy level based on the target date and time selected.
Greeks
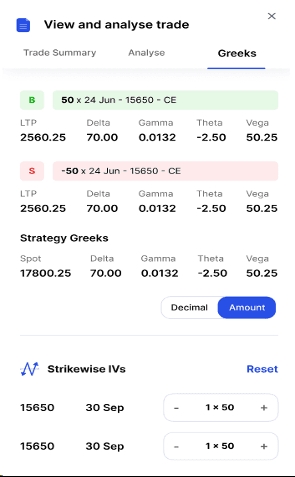
This section shows the Greeks for the overall position (strategy level) and for each individual leg. This can help you understand how changes in market conditions will affect your overall position and your individual positions. You can also change the implied volatility (IV) and see how it affects the Vega value for the overall position and for each individual leg.
Also you can see Greeks in Decimal format wherein you can see the absolute figure and also can see in Amount which is as per position level.
This tool helps users evaluate the potential outcomes of F&O strategies and identify potential profit or loss for each scenario. Users can select a target price, date, and time to see how their position will be affected by different market conditions. This information can help traders make informed decisions about their trades and assess the risks associated with their positions.
Watch Analyse feature demo : https://youtu.be/wIByJLd6k_A?si=a-8btUMWjDl86qfG
We are delighted to hear about your experience with the Payoff Analyser feature. Your feedback is valuable to us, and we are always looking for ways to improve our services. We would be grateful to hear any suggestions you have for enhancing your trading experience with HDFC SKY.
Give the Pay Off Analyse feature on the HDFC SKY trading app a try today and discover the potential of F&O trading! Happy Trading!


About Author

Peter Cutinho
Open Free Demat Account
Open Free Demat Account
Popular Posts
- 10 Interesting Facts About NSE You Probably Didn’t KnowLast Updated: Sep 30, 2026
- 8-4-3 Rule of SIP - How Does That Work?Last Updated: Jul 30, 2025
- Let's view more exciting Post!
Popular Post from Derivatives
- Celebrating Innovation: HDFC SKY Shares Perspectives on India’s F&O Market Growth on National Technology DayLast Updated: May 11, 2026
- The Basics: Why Call Options Deserve Your AttentionLast Updated: Jan 30, 2026
- Understandin͏g Moneyness: The Path ͏to Smarter Option Trading͏Last Updated: Jan 30, 2026
- Mastering Open Interest: A Trader’s Guide to Market Sentiment & Key LevelsLast Updated: Jun 20, 2025
- New Position Page in The HDFC SKY App for Smarter TradingLast Updated: Jan 21, 2025
- Let's view more exciting Post!
Popular Post from Blogs
- “Bounce Back” Theme Gains Traction in 2026Last Updated: Apr 8, 2026
- 5 Takeaways for Tax Payers from the Budget 2025Last Updated: Jan 29, 2026
- Let’s view more exciting Posts


Invest Anytime, Anywhere


By signing up I certify terms, conditions & privacy policy