Nifty 50
- ITC₹266.6011.10 (4.34%)
- Shriram Finance₹1,059.10-50.80 (-4.58%)
- Bharti Airtel₹1,877.2065.30 (3.60%)
- Maruti Suzuki₹12,950-597.00 (-4.41%)
- Adani Ports₹1,647.5054.40 (3.41%)
- Nestle₹1,438.20-58.30 (-3.90%)
- HCL Technologies₹1,351.4039.20 (2.99%)
- Max Healthcare₹1,003-39.10 (-3.75%)
- Reliance Industries₹1,30932.00 (2.51%)
- InterGlobe Aviation₹5,052-182.00 (-3.48%)
- ONGC₹236.454.65 (2.01%)
- Axis Bank₹1,258-42.00 (-3.23%)
- Infosys₹1,15622.20 (1.96%)
- Asian Paints₹2,575.50-78.10 (-2.94%)
- Bajaj Auto₹12,361231.00 (1.90%)
- Sun Pharmaceutical₹1,929-55.80 (-2.81%)
- Dr. Reddy's Labs₹1,17116.60 (1.44%)
- Bajaj Finserv₹1,972-49.00 (-2.42%)
- Hindustan Unilever₹1,994.8027.40 (1.39%)
- SBI₹1,034.50-25.50 (-2.41%)

- Offerings
- Tools & Platforms
Tools & Calculators
- Open API
- Calculators
- SIP Calculator
- CAGR Calculator
- Compound Interest Calculator
- FD Calculator
- RD Calculator
- EPF Calculator
- Retirement Calculator
- HDFC SIP Calculator
- Mutual Fund Return Calculator
- Lumpsum Calculator
- Step Up SIP Calculator
- ETF SIP Calculator
- Brokerage Calculator
- Equity Margin Calculator
- SWP Calculator
- EMI Calculator
- MTF Calculator
- Margin Pledge Calculator
- Algo Strategy
- Markets
Stocks
F&O
Mutual Funds
- More
India VIX Rises 2.06% as Crude and Global Risks Lift Volatility
Authored By HDFC SKY | Last Modified: Sep 1, 2026 04:17 PM IST
Open Free Demat Account
Open Free Demat Account
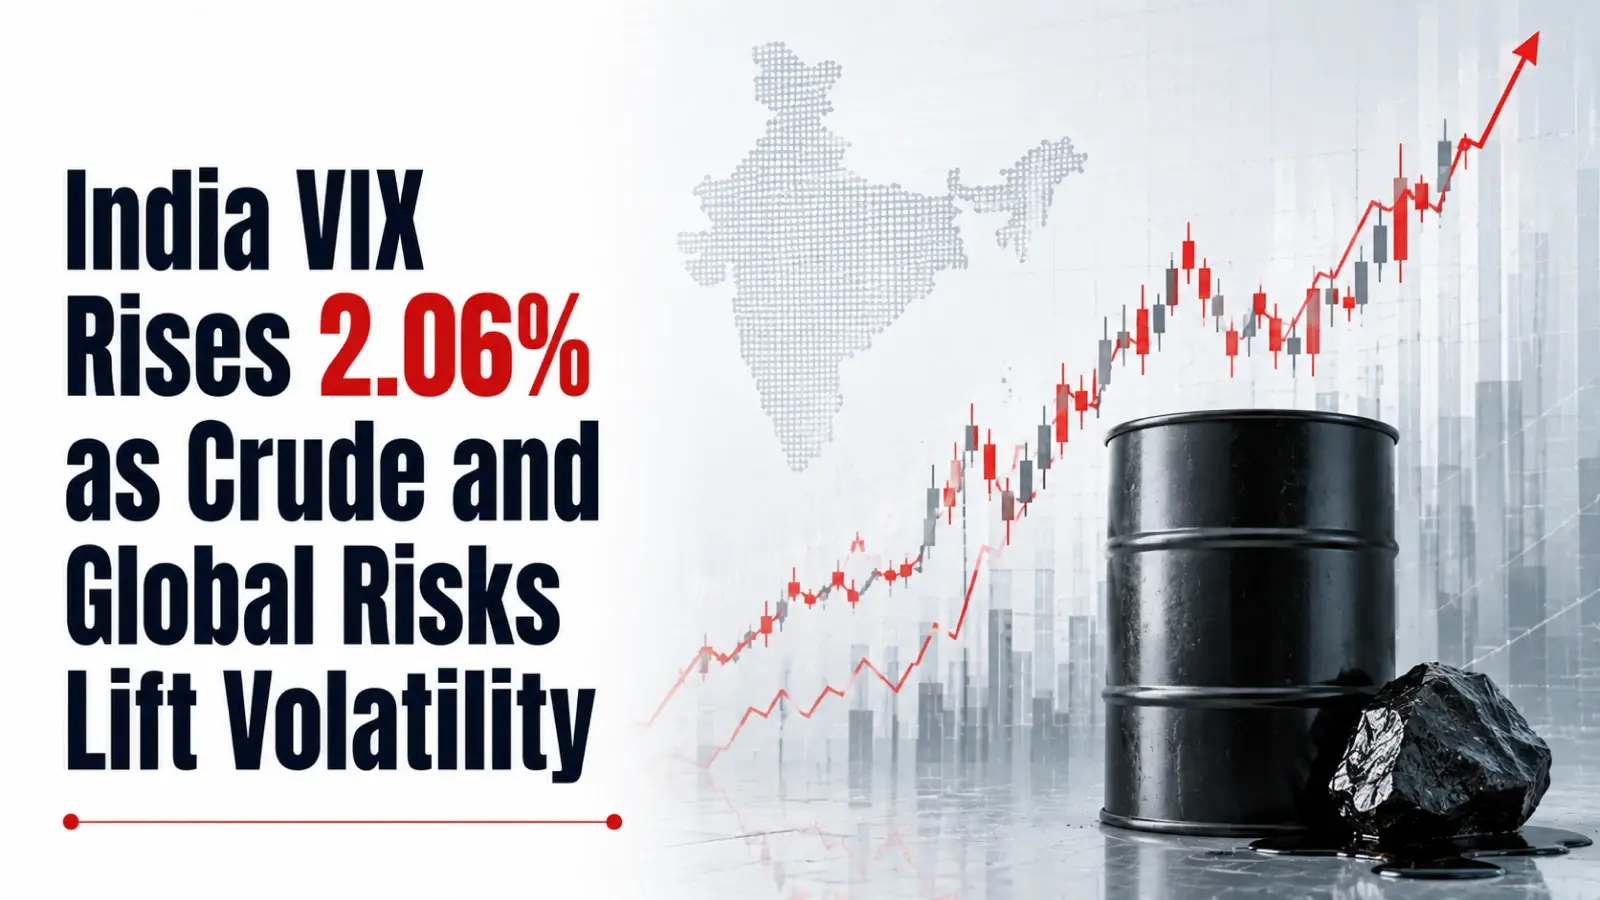
Mumbai, Sept 1: India VIX rose 0.23 points, or 2.06%, to 11.42 as of 15:37 IST on Tuesday, after moving sharply within an intraday range of 9.24 to 12.12. The volatility index opened at 11.19, unchanged from Monday’s close, before falling initially and then reversing higher. The move came as renewed US-Iran tensions, higher crude oil prices, rising global bond yields and weakness in Indian equities increased volatility during the session.

India VIX Hits 12.12 as Global Risks Intensify
India VIX started the session at 11.19, matching its previous close, but initially declined to an intraday low of 9.24. Volatility then reversed direction and climbed to a high of 12.12 before easing from the day’s peak. At 15:37 IST, the index stood at 11.42, up 2.06%.
Available end-of-day data referenced for the session puts the India VIX close at around 11.78, representing an increase of roughly 5.3% from Monday’s 11.19 close. The session therefore saw a wider movement than the unchanged opening indicated, with volatility increasing as trading progressed.
The India VIX remained within its 52-week range of 8.72 to 28.90. Its technical rating remained NEUTRAL. For the session, the Classic pivot levels stood at 11.53, 11.86 and 12.29 for resistance, with a pivot point of 11.10 and support levels at 10.77, 10.34 and 10.01.
US-Iran Tensions Push Oil And Volatility Higher
Renewed escalation between the US and Iran became a major global risk factor during the session, with reports pointing to intensified attacks and concerns over possible disruption to energy supplies through the Strait of Hormuz.
The developments increased uncertainty around crude oil supply and added pressure to global markets. For India, the geopolitical risks extended to concerns around the import bill, domestic inflation, the rupee, interest rates and corporate margins.
The wider uncertainty coincided with increased volatility during the Indian trading session. India VIX first declined towards 9.24, but later moved sharply higher as the broader risk backdrop deteriorated.
Brent Above $91 Raises India’s Oil Risk
Crude oil emerged as another key factor behind the increase in volatility. Brent crude moved above $91 a barrel, while reports during Asian trading placed it around $92.20, up roughly 2% at one point. The rise reflected concerns that continued US-Iran hostilities could affect energy flows through the Strait of Hormuz.
India’s dependence on imported crude made the increase particularly relevant to domestic markets. Higher oil prices raised concerns around inflation, the current-account balance, the rupee, corporate input costs, monetary policy and consumer purchasing power.
Indian equities came under pressure as crude moved higher. The combination of elevated oil prices and geopolitical uncertainty added to the risk surrounding domestic markets and coincided with the rise in India VIX.
Global Bond Yields Rise as Rate Risks Grow
Global bond markets also faced selling pressure as September began. Japan’s 10-year government bond yield touched 3%, its highest level since 1996, while the US 10-year Treasury yield reached around 4.79%. European government bond yields also moved higher.
Higher crude prices added to inflation concerns, while rising yields increased expectations around tighter monetary policy. Market pricing put the probability of a September US Federal Reserve rate hike at around 65%.
The combination of higher oil prices, rising yields and rate expectations weighed on global risk assets. For Indian markets, the developments also added uncertainty around foreign portfolio flows and interest-rate conditions.
US Futures Fall as September Trading Starts
US equity futures also weakened at the beginning of September. Futures linked to the Dow, S&P 500 and Nasdaq moved lower, while the S&P 500 volatility gauge increased.
The major US futures recorded declines of approximately 0.48% to 0.83% during the early session. The weaker global equity backdrop added to the pressure already created by higher oil prices and rising bond yields.
The sequence across global markets was marked by renewed US-Iran tensions, higher crude prices, rising inflation concerns, higher bond yields, increased rate-hike expectations and weaker equity futures. These developments coincided with the rise in India VIX during the Indian session.
Nifty Slips Below 24,000 As Volatility Climbs
Indian equities weakened during the session, providing a direct domestic backdrop to the movement in India VIX. The Nifty moved below 24,000, while the Sensex also remained under pressure.
During the early part of trading, the Nifty was around 24,050 and the Sensex around 76,924, with nine of 16 major sectors declining. Later in the afternoon, the Nifty was around 23,965, while the Sensex stood near 76,789.
At the same time, India VIX had climbed to approximately 11.90, up more than 6% at that point. The movement showed how volatility increased as weakness in the benchmark indices intensified during the session.
Banking and Pharma Weakness Adds to Market Pressure
Banking stocks faced pressure during the session, while pharmaceutical stocks also declined. The Nifty Pharma index fell about 1.62% during trading.
Weakness in banking stocks had a notable effect on the broader benchmark movement because financial stocks carry significant weight in the major indices. The decline across index-heavy sectors added to the weakness in Indian equities and coincided with the increase in India VIX.
The index’s movement from 9.24 to 12.12 therefore occurred alongside a broader deterioration in domestic equity performance rather than only the initial global headlines.
Rupee Strength and GDP Growth Provide Some Cushion
The rupee provided some support to the domestic backdrop during the session. The Reserve Bank of India (RBI) was reported to have likely sold US dollars before the Indian spot market opened, helping the rupee move towards the ₹95 per US dollar level.
The rupee traded around ₹95.025, compared with Monday’s close of ₹95.1625. The currency’s movement provided some offset to the pressure created by higher crude prices.
India’s latest 7.8% year-on-year GDP growth for April-June 2026 also remained a domestic cushion. The growth was supported by investment, manufacturing and consumer demand. However, the GDP figure was released before 1 September and was not a fresh event during Tuesday’s session.
September Seasonality Shows Mixed Volatility History
India VIX has recorded negative returns in 9 of 17 years during September. The month’s maximum positive change stands at 34.92% in 2018, while the average positive change is 19.02%. The maximum negative change is -26.10% in 2009, with an average negative change of -9.93%.
The historical average change for September stands at 3.69%. These figures provide the historical context for Tuesday’s movement as India VIX moved within a broad intraday range.
India VIX Ends Higher After a Volatile Session
The session began calmly at 11.19, with the index falling to 9.24, but volatility increased later as geopolitical tensions, crude prices, global bond yields and Indian equity weakness combined to pressure markets.
India VIX reached 12.12 intraday before easing. The index was at 11.42, up 2.06%, at 15:37 IST, while the available end-of-day data cited in the reference places the close at around 11.78. The move remained below the much higher levels recorded during previous volatility spikes.
India VIX moved higher on 1 September as renewed US-Iran tensions, Brent crude above $91, rising global bond yields and weaker Indian equities increased volatility during the session. Support from the rupee and India’s 7.8% GDP growth provided a partial domestic cushion, while the index remained within its 8.72–28.90 52-week range.
Source
- https://www.nseindia.com/reports-indices-historical-vix
Disclaimer
If you have any concerns, questions, or wish to point out any discrepancies in our content, please feel free to write to us at content@hdfcsec.com.
Please Note: The information shared is intended solely for informational purposes and does not make any investment recommendations
HDFC SKY, one of India’s most trusted trading platforms, has been recognized with the Next-Gen Digi Content Awards 2025–26.
 Join Us
 Add as preferred source on Google


More Business News









Open Free Demat Account
Open Free Demat Account










Invest Anytime, Anywhere


By signing up I certify terms, conditions & privacy policy