NSE Price Band Hitters Data, June 1, 2026:CP Plus World Among 129 Stocks That Hit Upper Band, JSW Infrastructure Logistics Tops 189 Stocks That Touched Lower Band
Authored By HDFC SKY | Last Modified: Jun 2, 2026 11:12 AM IST
NSE price band data showed 129 stocks locked in the upper circuit, 189 in the lower circuit and 24 hitting both bands as of market close on June 1.
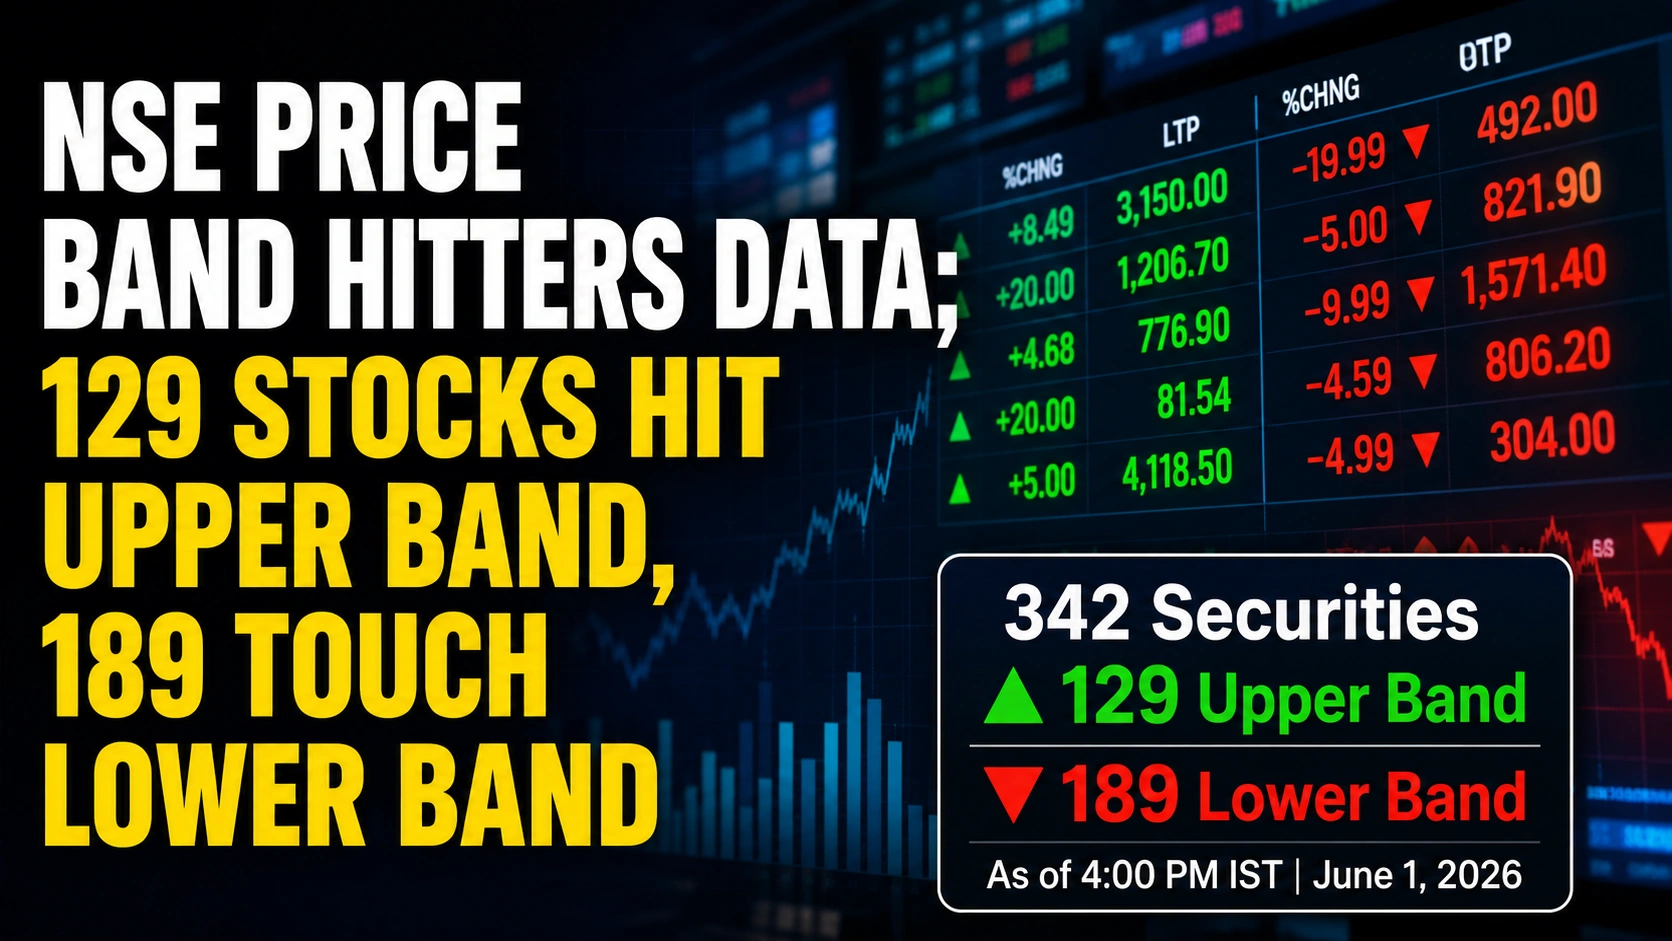
Mumbai, June 1: NSE’s Price Band Hitters report showed a sharp divergence in stock-specific trading activity, with 129 securities hitting their upper price band and 189 securities touching their lower price band as of 4:00 PM IST on June 1, 2026.
According to exchange data, a total of 342 securities featured in the price band monitoring list. Of these, 24 securities appeared in both categories during the session, indicating heightened volatility and sharp price swings.
Price bands are regulatory limits that restrict the maximum upward or downward movement in a stock’s price during a trading session. Stocks reaching these limits often indicate strong buying or selling pressure.
Share Price Impact Across Upper And Lower Circuit Stocks
The upper band list featured several stocks that witnessed significant gains and trading activity. Among the prominent movers were CP Plus World, Rubicon Research, NIIT Learning Systems, E2E Networks and Vidya Wires.
The lower band list was led by JSW Infrastructure Logistics, GPIL, DSSL, IdeaForge Technology and UTL Solar, reflecting sustained selling pressure in select counters.
Market participants often monitor such lists to identify unusual trading patterns, liquidity shifts and emerging sector-specific trends. The Price Band Hitters data can also influence short-term sentiment around a company’s share price movement.
Top Upper Band Hitters
| Symbol | LTP (₹) | Change (%) | Price Band (%) | Volume (Lakh Shares) | Value (₹ Crore) |
| CPPLUS | 3,150.00 | 8.49 | 10.00 | 17.22 | 541.77 |
| RUBICON | 1,206.70 | 20.00 | 20.00 | 38.38 | 435.08 |
| SUDEEPPHRM | 776.90 | 4.68 | 10.00 | 17.96 | 144.08 |
| NIITLTD | 81.54 | 20.00 | 20.00 | 163.87 | 128.61 |
| E2E | 4,118.50 | 5.00 | 5.00 | 2.49 | 102.28 |
| SIGMAADV | 430.00 | 1.22 | 5.00 | 15.79 | 68.30 |
| VIDYAWIRES | 114.08 | 5.00 | 5.00 | 58.47 | 66.36 |
| STLTECH | 562.95 | 5.00 | 5.00 | 8.63 | 48.57 |
| LUXIND | 1,417.90 | 2.72 | 5.00 | 1.39 | 19.81 |
| DEEDEV | 623.05 | 5.00 | 5.00 | 2.76 | 17.12 |
Top Lower Band Hitters
| Symbol | LTP (₹) | Change (%) | Price Band (%) | Volume (Lakh Shares) | Value (₹ Crore) |
| JSLL | 492.00 | -19.99 | 20.00 | 27.58 | 141.17 |
| GVPIL | 821.90 | -5.00 | 5.00 | 4.48 | 37.85 |
| DSSL | 1,571.40 | -9.99 | 10.00 | 1.87 | 29.72 |
| IDEAFORGE | 806.20 | -4.59 | 5.00 | 3.51 | 28.62 |
| UTLSOLAR | 304.00 | -4.99 | 5.00 | 7.20 | 22.72 |
| QLINE | 451.40 | -4.89 | 5.00 | 4.81 | 22.25 |
| KRN | 1,052.00 | -4.99 | 5.00 | 2.05 | 21.82 |
| SCHNEIDER | 1,243.40 | -5.00 | 5.00 | 0.86 | 10.64 |
| STYLEBAAZA | 325.00 | -4.02 | 5.00 | 2.90 | 9.65 |
| STLNETWORK | 29.40 | -3.13 | 5.00 | 30.61 | 9.11 |
Securities Appearing In Both Band Categories
| Symbol | LTP (₹) | Change (%) | Price Band (%) | Volume (Lakh Shares) | Value (₹ Crore) |
| MSPL | 40.75 | -4.61 | 5.00 | 27.47 | 11.49 |
| KESORAMIND | 12.41 | -0.80 | 5.00 | 16.43 | 2.08 |
| FILATFASH | 0.24 | 4.35 | 5.00 | 248.83 | 0.57 |
| NIRMAN | 49.00 | 0.41 | 5.00 | 0.98 | 0.48 |
| POLYSIL | 144.00 | -0.03 | 5.00 | 0.17 | 0.24 |
| BNAGROCHEM | 357.20 | -5.00 | 5.00 | 0.06 | 0.24 |
| AGSTRA | 2.35 | 4.91 | 5.00 | 6.72 | 0.15 |
| SABEVENTS | 8.38 | 4.88 | 5.00 | 1.81 | 0.14 |
| FCONSUMER | 0.32 | -3.03 | 5.00 | 34.09 | 0.11 |
| GURUNANAK | 38.00 | -1.81 | 5.00 | 0.26 | 0.10 |
Exchange Data Highlights Increased Stock-Specific Activity
The exchange data highlighted a considerably larger number of stocks hitting the lower band compared with the upper band. The trend suggests that selling pressure remained concentrated across a broader set of counters despite strong gains in select stocks.
Several securities on the upper band list recorded substantial traded values and volumes, indicating active participation from investors and traders. Meanwhile, stocks in the lower band category reflected persistent downside pressure during the session.
The NSE Price Band Hitters report remains a closely watched market indicator for identifying stocks experiencing exceptional demand, supply imbalances or heightened volatility.
Conclusion
The June 1 Price Band Hitters data showed 129 stocks reaching their upper circuit limits, while 189 stocks touched lower circuits and 24 appeared in both categories. The figures point to a highly stock-specific market environment where buying interest remained concentrated in select counters even as a larger number of securities faced selling pressure.
Source:
- https://www.nseindia.com/market-data/both-band-hitters
Disclaimer
If you have any concerns, questions, or wish to point out any discrepancies in our content, please feel free to write to us at content@hdfcsec.com.
Please Note: The information shared is intended solely for informational purposes and does not make any investment recommendations