Nifty 50
- HDFC Life Insurance ₹55726.80 (5.05%)
- ONGC₹232.43-4.37 (-1.85%)
- Tata Motors PV₹314.5013.50 (4.49%)
- Titan Company₹4,841-67.50 (-1.38%)
- SBI Life Insurance ₹1,766.9069.00 (4.06%)
- HDFC Bank₹713-8.50 (-1.18%)
- Dr. Reddy's Labs₹1,17535.00 (3.07%)
- Hindustan Unilever₹1,942.20-19.80 (-1.01%)
- Bharat Electronics₹395.459.70 (2.51%)
- Coal India₹418-4.25 (-1.01%)
- InterGlobe Aviation₹4,845111.50 (2.36%)
- Nestle₹1,370.60-13.90 (-1.00%)
- Tata Steel₹187.294.29 (2.34%)
- ICICI Bank₹1,347.60-11.20 (-0.82%)
- Cipla₹1,38527.00 (1.99%)
- Bajaj Auto₹11,500-93.00 (-0.80%)
- Jio Financial ₹229.304.46 (1.98%)
- Grasim Industries₹3,173.10-13.90 (-0.44%)
- Eternal₹322.355.35 (1.69%)
- Wipro₹166.40-0.49 (-0.29%)

- Offerings
- Tools & Platforms
Tools & Calculators
- Open API
- Calculators
- SIP Calculator
- CAGR Calculator
- Compound Interest Calculator
- FD Calculator
- RD Calculator
- EPF Calculator
- Retirement Calculator
- HDFC SIP Calculator
- Mutual Fund Return Calculator
- Lumpsum Calculator
- Step Up SIP Calculator
- ETF SIP Calculator
- Brokerage Calculator
- Equity Margin Calculator
- SWP Calculator
- EMI Calculator
- MTF Calculator
- Margin Pledge Calculator
- Algo Strategy
- Markets
Stocks
F&O
Mutual Funds
- More
- How to find Option Chain for any symbol?
- Option Chain – How can F&O traders benefit from it
- Features Available In Option Chain and Interpretation
- How to analyse option chain data live Interpretations?
- Option Greeks – Know how the premium reacts to a given change in price of the underlying
- How to place trade from Option Chain
- How to find Option Chain for any symbol?
- Option Chain – How can F&O traders benefit from it
- Features Available In Option Chain and Interpretation
- How to analyse option chain data live Interpretations?
- Option Greeks – Know how the premium reacts to a given change in price of the underlying
- How to place trade from Option Chain
Option Chain Analysis: Your Key to the World of Options Trading
By Tarang Solani | Updated at: May 13, 2025 03:01 PM IST

Open Free Demat Account
Open Free Demat Account
How to find Option Chain for any symbol?
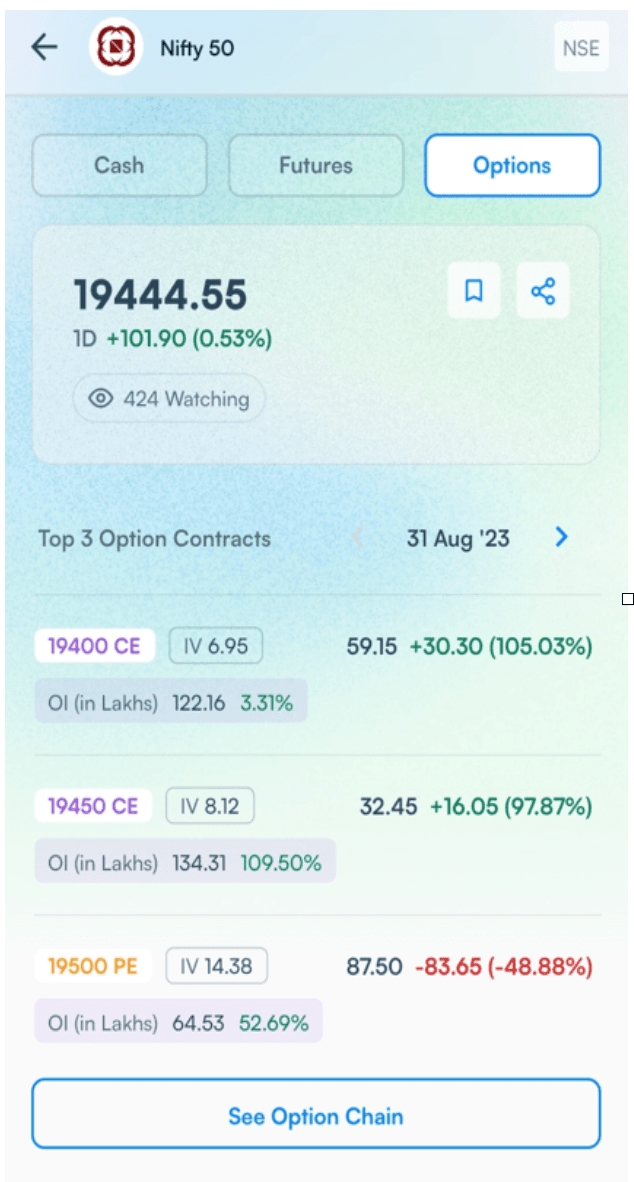
For any particular script once the user visits the company page. There is a feature of Option. Once the user clicks it the user can see Top 3 Options Contract traded of the nearest expiry along with a tab “See Option Chain”
Option Chain – How can F&O traders benefit from it
– Helps in Decision making
– Option Chain Analysis can be used to find out the actual trend of the particular stock or index. Usually institutions and big funds sell options. By finding out which strike has more open interest, we can actually understand the support and resistance levels of a security (be it stocks or indices) for that expiry. The Put strike with highest Open Interest is considered as Strong Support and the Call strike with highest open interest is considered as Strong Resistance.
– Ease of Trading
– Option chain helps the trader to see all the strike price of a particular symbol in one single screen. The trader can also select different expiry from that window and also it enables the user to pick the trade directly from that screen and execute it.
Features Available In Option Chain and Interpretation
Here you can get to know about all the columns present in the option chain feature(Option chain stocks, nifty, option chain bank nifty)
– Strike:
In the Strike, you can check the strike price of a particular stock. You can easily sort the Strike data from highest to lowest and lowest to highest by clicking on Strike.
– Open Interest:
This will show you the data of Open Interest of a particular Strike of the selected expiry. For every strike there will be open interest of call side and put side. This data helps you to identify the support and resistance. Call Strike price with highest open interest is treated as Strong resistance and Put Strike having highest open interest is treated as strong support
– OI change:
The OI Change column will show you the data of the OI change from yesterday’s close to today’s close. This is another analytical tool wherein the user can find where the trend is strengthening or weakening.
– LTP:
Last Traded Price (LTP) stands for the price of a stock on which the last transaction or trade occurred.
– Net change:
It is the net change in the LTP(last traded price).The positive change means rise in price and the negative change means decrease in price. On Expansion
How to analyse option chain data live Interpretations?

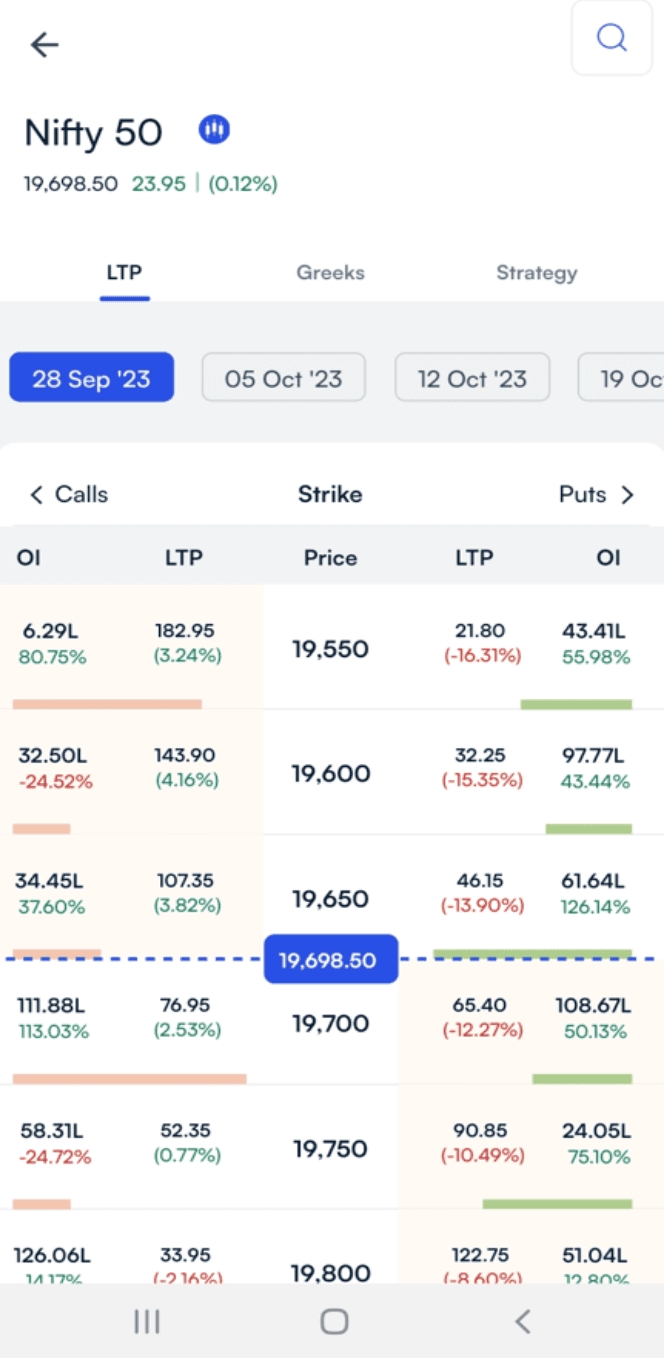
Consider the option chain of Nifty 50 of (28/09/2023) expiry. On the right side options chain it has all Put related data and on the left side it has all call related data. There is a line highlighted in blue which plots the current spot price and the option nearest to it is considered as At-The-Money (ATM) option. Also in order to recognise In-The-Money (ITM)
option yellow color shade is given for all the strike belongs to ITM option for Call side and Put side both.
The Put strike with highest Put Open Interest is considered as Strong Support, as more no of traders has shorted that option so it act as a strong support level for the market. Call strike with highest open interest is considered as a Strong Resistance that means If market breaks these levels means highest loss for big institutions so they don’t let it happen. If the same happens and we see unwinding in the strike price which we can see from the change in open interest that means that the big players are squaring off the position and there is high probability that the particular index/stocks moving in that direction for next few trading session.
This data helps to gauge the near term support and resistance of particular index/stock. With the help of the open interest bar line provided against all the strike, this will help to easily identify which strike for call and put is highest in open interest.
By using the Options Chain Data and Interpretations feature you can now easily interpret the option chain analysis of the current expiry at the live market. You can easily track the movement of options using the options chain. You can select the contract in the contract search and the corresponding expiry date to see the stock/index of that particular expiry.
Option Greeks – Know how the premium reacts to a given change in price of the underlying
If you want to know how option prices react to a given change in some of the variable inputs, you may turn into Greeks option.

In the Option Chain On the top of the option table you can view the Greek option, by clicking that you will see the Greeks table. The most commonly used Greeks are options chain with Delta, Gamma, Theta, Vega and Rho.
Here you can get to know all the features available in Option Greeks table
IV:
The IV column will show you the data on the implied volatility of a particular contract.
DELTA:
It is the change in the price of an option resulting from a change in underlying asset. It ranges from 0 to 1. At the money have a delta close to 0.5
GAMMA:
Delta is not constant, it changes as the price of underlying moves. Gamma measures change in the delta of an option in response to change in the price of an underlying asset.
THETA:
Theta represents the time decay of an option contract and specifies the time value or extrinsic value. The call put option loses its value every day as it approaches expiry.
VEGA:
Rate of change in the price of an option due to the change in the implied volatility. The higher the volatility higher probability of large price moments.
RHO:
Rho measures change in the price of an option relative to change in interest price.
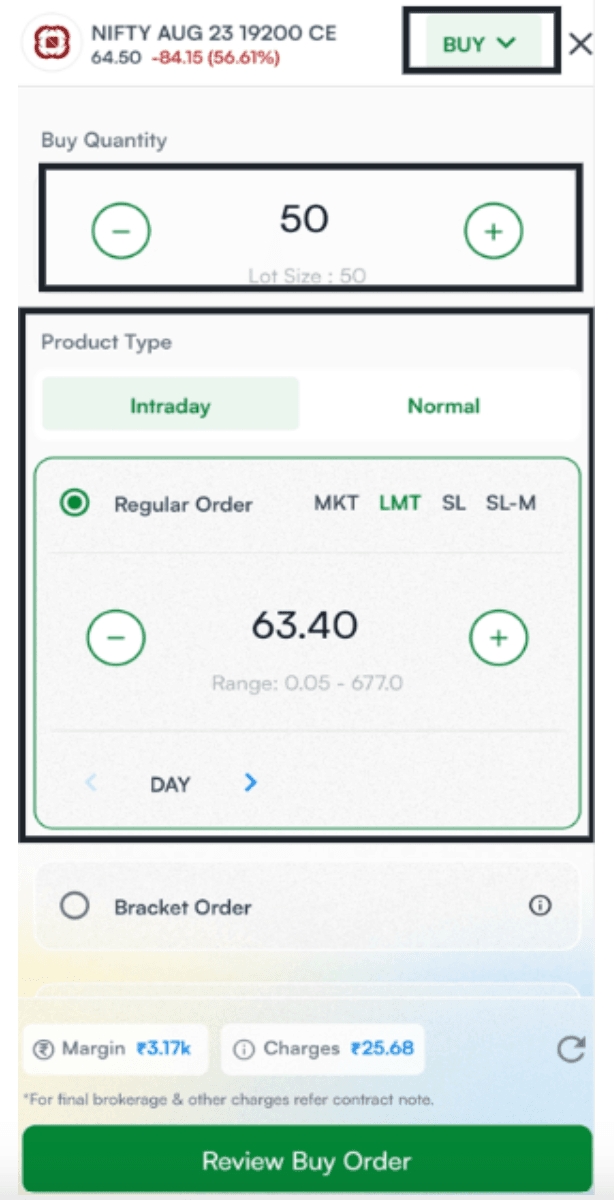
How to place trade from Option Chain
Step 1:-
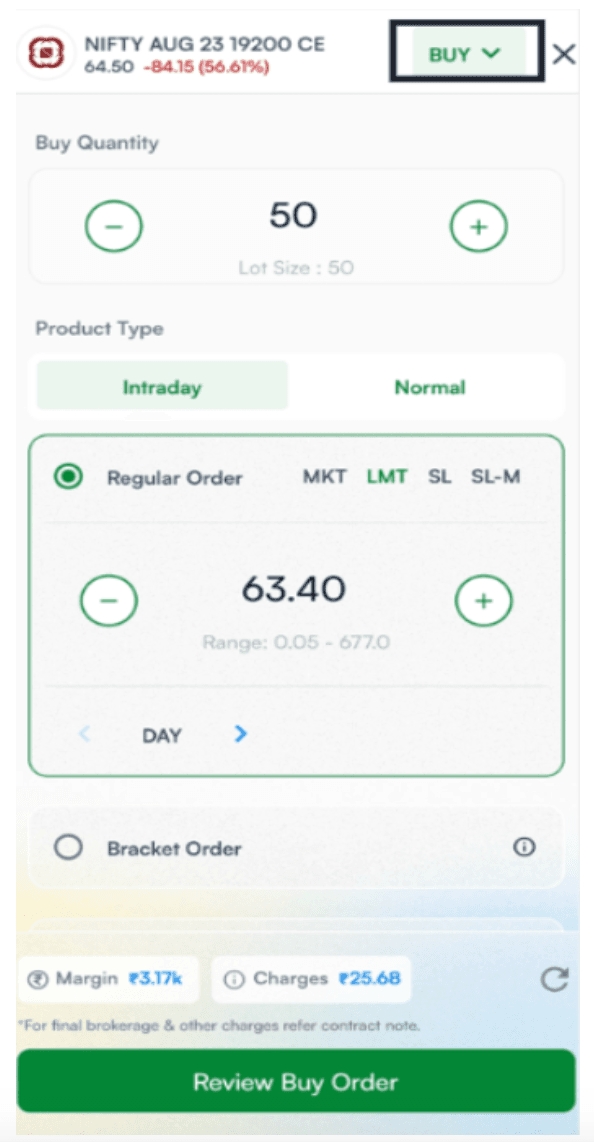
- Once the user clicks on any side of Call and Put they will get the option to review trade wherein the user can select the action to Buy and sell particular option contract.
Step 2:-
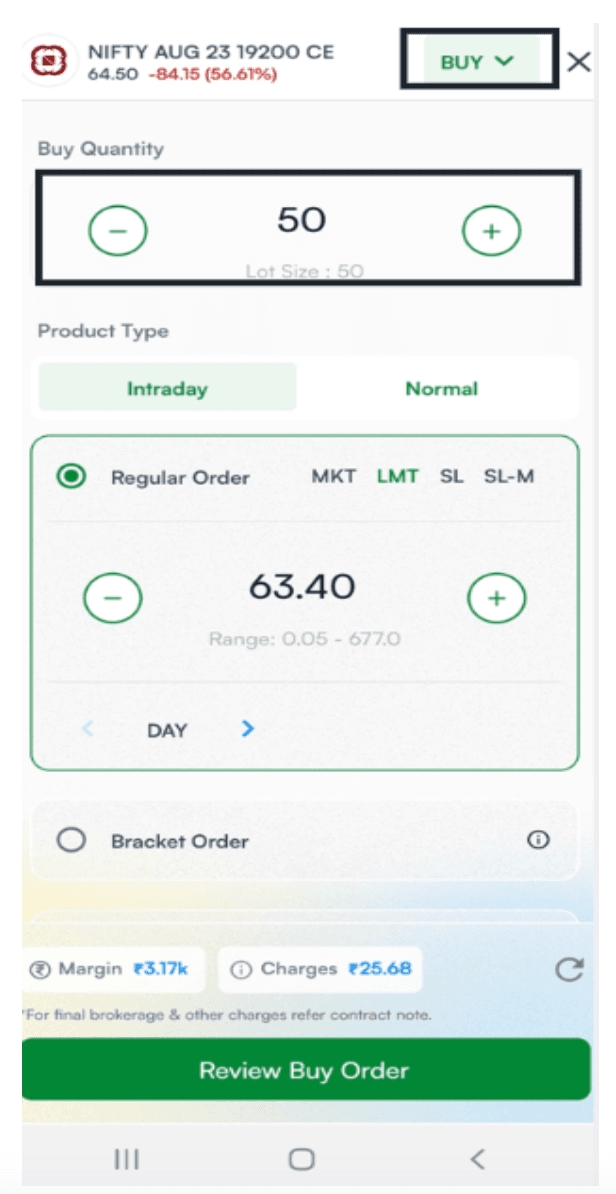
- Once the action Buy/Sell selected. The user has to fill the number of quantity to buy/sell. Below is the lot size which will help the user to fill the quantity in multiple of lot size.
Step 3:-
- Post that user will have to select Intraday or Normal (Carry forward) as the Product type. Along with the same user have to select Order type as MKT/LMT/SL
- Post the selection of Product type and Order type, the user will have to fill the price in case of Limit order/SL order as per the range specified. Based on the price entered, the margin required/fund required would be auto calculated along with charges.
- And then has to click on “Review Buy Order” to execute the same.
We’re excited to hear about your firsthand encounter with the Option Chain feature. Your feedback holds immense value for us, and we eagerly look forward to any suggestions you might have to enhance and elevate your trading experience with HDFC SKY.
Feel free to share your thoughts, as our commitment to improving our services for you is unwavering.
Happy trading! Give the Option Chain on the HDFC SKY trading app a try today and discover the potential of F&O trading! Happy Trading!


About Author

Tarang Solani
Open Free Demat Account
Open Free Demat Account
Popular Posts
- 3 Things New Investors Should Check Before Opening a Demat AccountLast Updated: Jul 15, 2026
- 5 Features Protecting Your Wealth on HDFC SKYLast Updated: Jul 1, 2026
- Let’s view more exciting Posts
Popular Post from Derivatives
- Celebrating Innovation: HDFC SKY Shares Perspectives on India’s F&O Market Growth on National Technology DayLast Updated: May 11, 2026
- The Basics: Why Call Options Deserve Your AttentionLast Updated: Jan 30, 2026
- Understandin͏g Moneyness: The Path ͏to Smarter Option Trading͏Last Updated: Jan 30, 2026
- Mastering Open Interest: A Trader’s Guide to Market Sentiment & Key LevelsLast Updated: Jun 20, 2025
- New Position Page in The HDFC SKY App for Smarter TradingLast Updated: Jan 21, 2025
- Let's view more exciting Post!
Popular Post from Blogs
- “Bounce Back” Theme Gains Traction in 2026Last Updated: Apr 8, 2026
- 5 Takeaways for Tax Payers from the Budget 2025Last Updated: Jan 29, 2026
- Let’s view more exciting Posts


Invest Anytime, Anywhere


By signing up I certify terms, conditions & privacy policy