Nifty 50
- Bajaj Auto₹10,090312.00 (3.19%)
- Tech Mahindra₹1,462.80-51.30 (-3.39%)
- Tata Steel₹176.272.47 (1.42%)
- Bharti Airtel₹1,767-38.10 (-2.11%)
- Mahindra & Mahindra₹2,835.3039.10 (1.40%)
- ITC₹261.90-4.10 (-1.54%)
- JSW Steel₹1,183.4015.40 (1.32%)
- SBI₹947.65-11.45 (-1.19%)
- Dr. Reddy's Labs₹1,212.3015.30 (1.28%)
- Axis Bank₹1,251.10-8.00 (-0.64%)
- Eicher Motors₹7,138.5088.50 (1.26%)
- Hindustan Unilever₹1,847-9.70 (-0.52%)
- Bharat Electronics₹372.754.60 (1.25%)
- ICICI Bank₹1,348.60-6.40 (-0.47%)
- HDFC Life Insurance ₹563.556.90 (1.24%)
- ONGC₹220.31-0.96 (-0.43%)
- Trent₹2,952.7034.50 (1.18%)
- NTPC₹310.90-1.10 (-0.35%)
- Max Healthcare₹893.709.90 (1.12%)
- L&T₹3,693.30-10.00 (-0.27%)

- Offerings
- Tools & Platforms
Tools & Calculators
- Open API
- Calculators
- SIP Calculator
- CAGR Calculator
- Compound Interest Calculator
- FD Calculator
- RD Calculator
- EPF Calculator
- Retirement Calculator
- HDFC SIP Calculator
- Mutual Fund Return Calculator
- Lumpsum Calculator
- Step Up SIP Calculator
- ETF SIP Calculator
- Brokerage Calculator
- Equity Margin Calculator
- SWP Calculator
- EMI Calculator
- MTF Calculator
- Margin Pledge Calculator
- Algo Strategy
- Markets
Stocks
F&O
Mutual Funds
- More
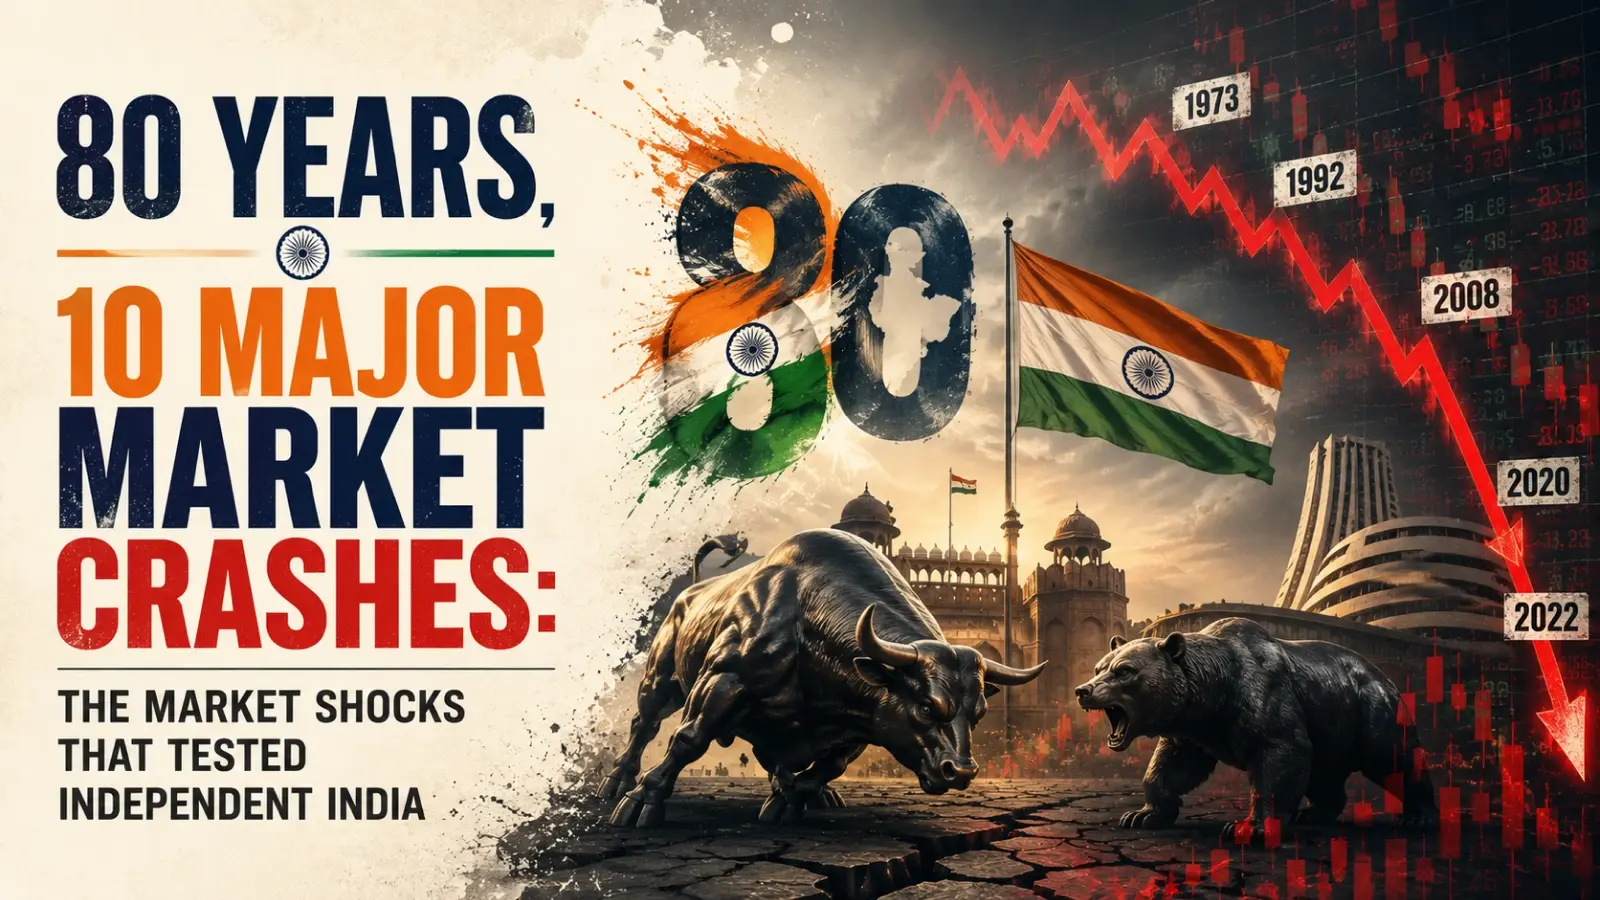
80 Years, 10 Major Market Crashes: The Shocks That Tested Independent India
Authored By HDFC SKY | Published at: Aug 14, 2026 05:38 PM IST
Open Free Demat Account
Open Free Demat Account
Mumbai, Aug 14: As India prepares to mark its 80th Independence Day, the country’s stock market’s history can be read through the crises that repeatedly tested it. From the 1992 securities scam and the 2000 dot-com collapse to the 2008 global financial crisis, the 2020 COVID-19 crash, the 2024 election shock, and the market episodes of 2025–26, each disruption exposed different vulnerabilities.
What changed after these episodes was not simply the level of the Sensex. India’s market infrastructure, regulation, settlement systems, investor access, foreign-capital framework, and risk controls evolved substantially over the same period. The journey, therefore, runs from a broker-driven market dominated by physical certificates to an electronic market with nationwide access, dematerialised ownership, and millions of participants.
The ten episodes below show how India’s stock market absorbed shocks from domestic financial frauds, global technology valuations, banking and credit stress, currency pressure, political uncertainty, pandemics, and geopolitical conflicts—and how the architecture of the market developed around those experiences.
-

1992 Harshad Mehta Scam: A Fragile Market Exposed
The first defining market shock of liberalising India came in 1992, when the securities scam involving broker Harshad Mehta exposed weaknesses in the links between banks, government securities, and the equity market.
The episode followed an extraordinary rally. The Sensex had risen 82% in 1991, helped by expectations surrounding economic liberalisation. After the July 1991 reforms, the index continued climbing and rose 94% between July 24, 1991 and 28 February 1992. It crossed 4,000 for the first time in March 1992 and reached a high of 4,467.32 on April 22.
The subsequent reversal was severe. On April 28, 1992, as details of the securities scam emerged, the Sensex fell 12.77%, its largest one-day percentage decline at that time. It fell another 23% in May. Yet the index still ended higher for the year, illustrating how a major market collapse could occur within a broader structural bull phase.
The underlying problem was not simply one broker. Investigations found that banking instruments, including bankers’ receipts and securities general ledger forms, had been misused to channel funds into securities transactions. The episode exposed weaknesses in the banking and securities market interface and shortcomings in regulation and settlement.
The institutional response became one of the most important foundations of modern Indian markets. SEBI, which had been established in 1988, received statutory powers under the SEBI Act, 1992. The Capital Issues (Control) Act, 1947 was repealed, removing government control over the pricing of new capital issues and moving towards a disclosure-based framework.
The 1992 crash, therefore, marked a turning point: India’s market was opening to capital, but its regulatory architecture had to evolve just as rapidly.
-
2000 Dot-Com Crash: End of the Technology Boom
Less than a decade later, the source of market excess shifted from financial manipulation to technology valuations.
The late 1990s brought rapid growth in technology companies, supported by the global internet boom and the Y2K opportunity. India’s software industry became increasingly important to the equity market, and the Sensex crossed 6,000 in the year 2000. The rally, however, was closely connected to the global technology bubble.
When the dot-com bubble burst, technology shares globally suffered a sharp repricing. Indian equities were also affected. The Sensex fell from 5,001 at the end of March 2000 to 3,184 by April 12, 2001, a cumulative decline of 36.3%. It subsequently fell to 2,600 on September 21, 2001, following further global market weakness after the September 11 attacks in the United States.
The episode was important because India’s market was now increasingly exposed to global technology valuations and international capital flows. It was no longer insulated by the domestic economic structure that had characterised earlier decades.
By this stage, however, the infrastructure had already begun changing. The National Stock Exchange (NSE) had introduced electronic trading in the 1990s, while dematerialised settlement had reduced reliance on physical certificates. In 2001, SEBI introduced market-wide circuit breakers at 10%, 15%, and 20% movements in the Sensex or Nifty, designed to coordinate trading halts during extreme market moves.
The dot-com crash, therefore, occurred in a market that was already substantially different from the one that had experienced the 1992 scam.
-
2008 Global Crisis: Global Shock Turned into Market Collapse
The largest global financial shock of the modern era produced India’s most important pre-COVID market collapse.
The Sensex had reached 21,078 on January 8, 2008, after crossing 20,000 in October 2007. The rally reflected strong economic growth, corporate investment, expanding credit, and substantial foreign portfolio inflows. The global financial crisis then changed the direction of markets worldwide.
The scale of the reversal was visible throughout 2008. The Sensex fell below 13,000 in July, below 12,000 in October, and below 10,000 on 17 October. On October 24, 2008, it closed at 8,701.07, down more than 10% during the day’s trading.
The shock was particularly important for India because the preceding boom had created a much more globally connected financial market. Foreign institutional investors had become major participants, while Indian banks, companies, and financial institutions were increasingly integrated into international capital flows.
The circuit-breaker framework introduced earlier was activated during the turmoil. On January 22, 2008, the NSE reported that trading had been halted after the Nifty breached the 10% circuit level, demonstrating that the market’s new risk-control infrastructure was being used during a major global shock.
The 2008 crisis also established an important feature of India’s later market history: external shocks could produce exceptionally large domestic price movements even when the original source of the crisis was outside India.
-
2013 Taper Tantrum: India’s Currency Vulnerability Exposed
The next major correction came through the currency and capital flow channel. In 2013, markets were shaken by expectations that the US Federal Reserve would begin reducing its bond purchases. The prospect of tighter global liquidity triggered selling across emerging markets, while India was simultaneously dealing with a large current-account deficit and pressure on the rupee.
On August 16, 2013, the Sensex fell 769.41 points (3.97%) to 18,598.18, its biggest one-day fall in four years at that time. The rupee fell to around ₹62 per US dollar, while India’s volatility index rose 26.4%, its largest single-day percentage increase since June 2009.
The stress continued. By August 21, the Sensex had fallen 1,461.68 points, or 7.55%, over four trading sessions, while the rupee had continued to weaken.
This episode demonstrated that foreign monetary policy could affect Indian equities through several interconnected channels: foreign portfolio flows, the rupee, government-bond yields, and expectations for domestic interest rates.
The response included measures from the Reserve Bank of India to address currency pressure and capital flows. The episode also reinforced the importance of India’s external balances and foreign portfolio participation in determining market volatility.
Unlike 1992, there was no single domestic fraud at the centre of the crisis. The vulnerability came from India’s growing integration with global financial conditions.
-
2016 Demonetisation: Creation of a Domestic Demand Shock
On November 8, 2016, the government announced the withdrawal of legal tender status for existing ₹500 and ₹1,000 notes. The decision immediately affected a market in which cash remained important for consumption, property, automobiles, and other sectors.
The Sensex fell sharply as the announcement was absorbed alongside uncertainty surrounding the US presidential election. On November 9, the index plunged 1,688.69 points (6.12%) to 25,902.45 during the session. Realty, consumer durables, and automobile stocks were among the sectors under heavy pressure.
The correction continued over subsequent sessions. By November 21, the Sensex had fallen more than 1,800 points from the November 8 level, while more than ₹9.20 lakh crore of equity market wealth had been erased, according to contemporary reporting.
The episode was fundamentally different from 2008. It originated in a domestic policy decision rather than a global financial collapse. Its market impact was concentrated particularly around businesses dependent on cash-driven economic activity.
The longer-term significance was not confined to the stock market. The period accelerated India’s shift towards electronic payments and formal financial channels, although those developments had already been under way. For capital markets, the episode demonstrated how a major policy decision affecting the wider economy could quickly translate into sector-specific equity volatility.
-
2018 IL&FS Crisis: Credit and Liquidity Risks Exposed
The 2018 Infrastructure Leasing & Financial Services (IL&FS) crisis shifted attention from equities towards the interconnectedness of India’s debt, NBFC, and financial markets.
IL&FS and its group companies began missing debt obligations from August 27, 2018. The group’s consolidated debt was reported at close to ₹1 lakh crore, and its defaults contributed to a liquidity freeze in the debt market.
The stress quickly moved into equities. On September 21, 2018, the Sensex swung nearly 1,500 points intraday as NBFC stocks came under heavy selling pressure. It ultimately closed 279.62 points lower, but the scale of the intraday movement demonstrated the severity of the stress on the financial sector.
On September 24, the Sensex fell another 536.58 points (1.46%) to 36,305.02, amid continuing concerns over the IL&FS debt crisis and liquidity conditions.
The episode exposed the risks associated with financial institutions borrowing over shorter periods to fund longer-term assets. It also highlighted how stress in debt markets could spill into listed banks, housing-finance companies, and NBFCs.
The response included a government takeover of the IL&FS board and a restructuring process through the National Company Law Tribunal. The episode subsequently contributed to closer attention to NBFC liquidity, asset-liability management, and the broader financial system.
-
2020 COVID Crash: India’s Fastest Market Shock
The COVID-19 crash was different from every previous episode because the shock originated simultaneously in public health, economic activity, global trade, and financial markets.
Global markets were already falling as the pandemic spread. On 12 March 2020, the Sensex fell 2,919 points, while the Nifty declined 12.98% according to contemporary reporting.
The selling intensified after India’s Janta Curfew on March 22 and the subsequent lockdown measures. On March 23, the Sensex plunged 3,934.72 points (13.15%), closing at 25,981.24. The Nifty fell 12.98% that day.
The circuit-breaker system introduced in 2001 again became central. Trading was halted after the Sensex fell 10% shortly after the market opened, illustrating how the risk control framework designed after earlier crises functioned during an unprecedented shock.
The market’s recovery was also unusually rapid. Monetary and fiscal measures, reopening expectations, and global policy support contributed to a reversal in financial market conditions later in 2020.
COVID, therefore, tested not just prices but the market’s ability to remain operational during an economy-wide shutdown. Electronic trading, dematerialised ownership, and digital access allowed the market to continue functioning despite severe restrictions on physical movement.
-
2022 Russia–Ukraine War: Drop in Oil and Markets
The Russia–Ukraine war produced another external shock, this time through geopolitics, commodities, and inflation.
Following Russia’s invasion of Ukraine, crude oil prices moved above $100 a barrel, raising concerns for India because of its dependence on imported energy. On 24 February 2022, the Sensex fell 2,702.15 points (4.72%) to 54,529.91, while the Nifty fell 4.78% to 16,247.95. India’s market capitalisation declined by roughly ₹13.57 lakh crore that day.
The sell-off was particularly notable because it represented the largest single-session decline in almost two years and came after a prolonged sequence of falling sessions.
Unlike the 2008 crisis, the banking system itself was not at the centre of the shock. Instead, the transmission mechanism ran through crude oil, inflation, currencies, interest rates, and global risk conditions.
The episode reinforced a lesson that had already emerged during the 2013 taper tantrum: India’s stock market had become so sufficiently integrated with global commodity and financial markets that geopolitical developments thousands of kilometres away could produce immediate domestic market consequences.
-
2024 Election Shock: Political Risk Still Mattered
The 2024 Lok Sabha election results produced one of the sharpest political event– driven market moves in India’s recent history.
Ahead of the results, exit polls had broadly indicated a strong performance for the incumbent alliance. The actual results were less decisive, creating a sudden repricing of expectations during trading on 4 June 2024.
The Sensex fell more than 6,200 points intraday before closing 4,390 points (5.74%) lower at 72,079. The Nifty fell 1,379 points (5.93%) to around 21,885. The BSE MidCap index fell as much as 12% intraday, while the SmallCap index also experienced a sharp decline.
The rupee also weakened as early election trends generated uncertainty around the composition and strength of the next government.
The episode demonstrated that even after decades of financial market development, elections remained capable of producing rapid repricing when the political outcome differed materially from expectations.
But it also illustrated the difference between an event-driven correction and a systemic financial crisis. There was no banking collapse, settlement failure, or market-infrastructure breakdown. India’s exchanges, clearing systems, and electronic trading infrastructure continued functioning despite the scale of the price movement.
-
2025–26 Brought Tariffs, AI, and Geopolitics into Focus
The latest market episodes have shown that India’s vulnerabilities have become increasingly global and technology-linked.
In 2025, foreign portfolio investors sold approximately ₹1.6 trillion ($18 billion) of Indian equities, the largest annual foreign outflow on record, according to Reuters. The pressures included elevated valuations, weaker earnings expectations, geopolitical concerns, and uncertainty surrounding US tariffs. The Nifty 50 and Sensex nevertheless gained around 10% during the year, supported by strong domestic institutional buying.
The correction was particularly visible in February 2025. During that month, the Sensex declined 5.6% and the Nifty 5.9%, while foreign investors sold almost $3.5 billion of Indian equities.
The nature of the risk changed again in 2026. In February 2026, concerns about AI’s (artificial intelligence) potential impact on global technology businesses produced a sharp sell-off in Indian IT stocks. The Nifty IT index fell 19.5% during this month, its worst monthly performance since September 2008, while the Sensex declined 1.2%.
2026 has also brought fresh episodes linked to trade negotiations, foreign flows, crude oil, and geopolitical tensions. On 14 August 2026, the Sensex was around 77,820.91 in morning trading, down 0.33%, while the Nifty fell 0.26%, as higher crude prices following renewed US–Iran tensions weighed on markets.
These episodes are evidently different from the 1992 scam or the 2008 banking crisis. India’s market now faces a much wider range of transmission channels, including global tariffs, artificial intelligence, foreign flows, energy prices, exchange rates, and geopolitical disruptions.
Ten Crashes, One Ever-Changing Market
The ten episodes reveal an important pattern across independent India’s market history. The 1992 scam exposed weaknesses in banking and securities regulation. The response strengthened SEBI and changed the framework for capital raising. The 2000 technology crash occurred as electronic trading and modern market infrastructure were taking shape. The 2008 global crisis demonstrated the importance of circuit breakers and the risks created by international capital integration.
The 2013 taper tantrum exposed India’s sensitivity to foreign liquidity and currency movements. The 2016 demonetisation episode showed how domestic policy decisions could rapidly affect listed companies. The 2018 IL&FS crisis revealed the links between debt market liquidity, NBFCs, and equities. The 2020 COVID crash tested whether India’s electronic market infrastructure could continue functioning during an unprecedented economic shutdown.
The 2022 Russia–Ukraine shock demonstrated the importance of commodities and geopolitical risk. The 2024 election correction showed that political outcomes could still generate one-day market moves of almost 6%. The 2025–26 episodes have added tariffs, artificial intelligence, foreign outflows, and Middle East tensions to the list of risks confronting India’s increasingly global market.
The market has consequently evolved from the system that existed 80 years ago. Physical certificates gave way to dematerialised ownership. Open-outcry trading gave way to electronic order books. Broker-led access expanded into internet and mobile platforms. Market-wide circuit breakers were introduced. Foreign investors became important participants, while domestic mutual funds and households subsequently became much larger sources of capital.
The crashes, therefore, form a parallel history of India’s financial-market development. Each shock exposed a different vulnerability; the market architecture that exists today was built through the accumulated experience of dealing with those vulnerabilities.
India’s market history since Independence is also a history of financial system adaptation. The 1992 scam, 2000 technology crash, 2008 crisis, 2013 taper tantrum, 2016 demonetisation, 2018 IL&FS stress, 2020 pandemic, 2022 war, 2024 election shock, and 2025–26 global episodes each tested different parts of the market, while regulation, technology, settlement systems, and participation continued to evolve.
Source
- https://www.sebi.gov.in/sebi_data/commondocs/pt01_h.html
- https://www.sebi.gov.in/acts/act15ac.html
- https://www.sebi.gov.in/legal/circulars/jun-2001/index-based-market-wide-circuit-breaker-in-compulsory-rolling-settlement_17986.html
- https://www.sebi.gov.in/sebi_data/docfiles/15937_t.html
- https://www.bseindices.com/Downloads/SENSEX40Paper.pdf
- https://www.pib.gov.in/newsite/erelcontent.aspx?relid=56659
- https://www.indiabudget.gov.in/budget_archive/es2001-02/general.htm
- https://www.mdpi.com/2071-1050/13/5/2873
- https://www.rbi.org.in/commonman/english/scripts/PressReleases.aspx?Id=1924
Disclaimer
If you have any concerns, questions, or wish to point out any discrepancies in our content, please feel free to write to us at content@hdfcsec.com.
Please Note: The information shared is intended solely for informational purposes and does not make any investment recommendations
Disclaimer
At HDFC SKY*, we take utmost care and due diligence in curating and presenting news and market-related content. However, inadvertent errors or omissions may occasionally occur.
If you have any concerns, questions, or wish to point out any discrepancies in our content, please feel free to write to us at content@hdfcsec.com.
Please Note: The information shared is intended solely for informational purposes and does not make any investment recommendations.
HDFC SKY from HDFC Securities, one of most trusted trading platforms in India, has been recognized with the *Next-Gen Digi Content Awards 2025-26.
 Join Us
 Add as preferred source on Google


More Business News







Open Free Demat Account
Open Free Demat Account










Invest Anytime, Anywhere


By signing up I certify terms, conditions & privacy policy