Nifty 50
- Bajaj Auto₹10,090312.00 (3.19%)
- Tech Mahindra₹1,462.80-51.30 (-3.39%)
- Tata Steel₹176.272.47 (1.42%)
- Bharti Airtel₹1,767-38.10 (-2.11%)
- Mahindra & Mahindra₹2,835.3039.10 (1.40%)
- ITC₹261.90-4.10 (-1.54%)
- JSW Steel₹1,183.4015.40 (1.32%)
- SBI₹947.65-11.45 (-1.19%)
- Dr. Reddy's Labs₹1,212.3015.30 (1.28%)
- Axis Bank₹1,251.10-8.00 (-0.64%)
- Eicher Motors₹7,138.5088.50 (1.26%)
- Hindustan Unilever₹1,847-9.70 (-0.52%)
- Bharat Electronics₹372.754.60 (1.25%)
- ICICI Bank₹1,348.60-6.40 (-0.47%)
- HDFC Life Insurance ₹563.556.90 (1.24%)
- ONGC₹220.31-0.96 (-0.43%)
- Trent₹2,952.7034.50 (1.18%)
- NTPC₹310.90-1.10 (-0.35%)
- Max Healthcare₹893.709.90 (1.12%)
- L&T₹3,693.30-10.00 (-0.27%)

- Offerings
- Tools & Platforms
Tools & Calculators
- Open API
- Calculators
- SIP Calculator
- CAGR Calculator
- Compound Interest Calculator
- FD Calculator
- RD Calculator
- EPF Calculator
- Retirement Calculator
- HDFC SIP Calculator
- Mutual Fund Return Calculator
- Lumpsum Calculator
- Step Up SIP Calculator
- ETF SIP Calculator
- Brokerage Calculator
- Equity Margin Calculator
- SWP Calculator
- EMI Calculator
- MTF Calculator
- Margin Pledge Calculator
- Algo Strategy
- Markets
Stocks
F&O
Mutual Funds
- More
India @ 80: How the Stock Market Tracked India’s Transformation from a Closed Economy to a Global Investment Destination
Authored By HDFC SKY | Last Modified: Aug 14, 2026 05:36 PM IST
Open Free Demat Account
Open Free Demat Account
Mumbai, Aug 14: As India prepares to mark its 80th Independence Day, its stock market offers an unusually detailed record of the country’s economic transformation. The journey runs from a market built around physical share certificates, broker-led trading and extensive government controls to a capital-market system with around 145 million investors, more than 21 crore demat accounts, mutual-fund assets of more than ₹80 trillion and market capitalisation above ₹470 trillion. The BSE Sensex, whose historical base is 100, is now trading around the 77,000-point level.
The numbers are significant because India’s stock market did not grow in isolation. Its expansion followed changes in industrial policy, private enterprise, foreign capital, technology, household savings, banking, consumption, infrastructure and digitalisation. Every major stage of India’s economic development left a mark on the companies listed on its exchanges, the sectors represented in the benchmark indices and the way households participated in financial markets.
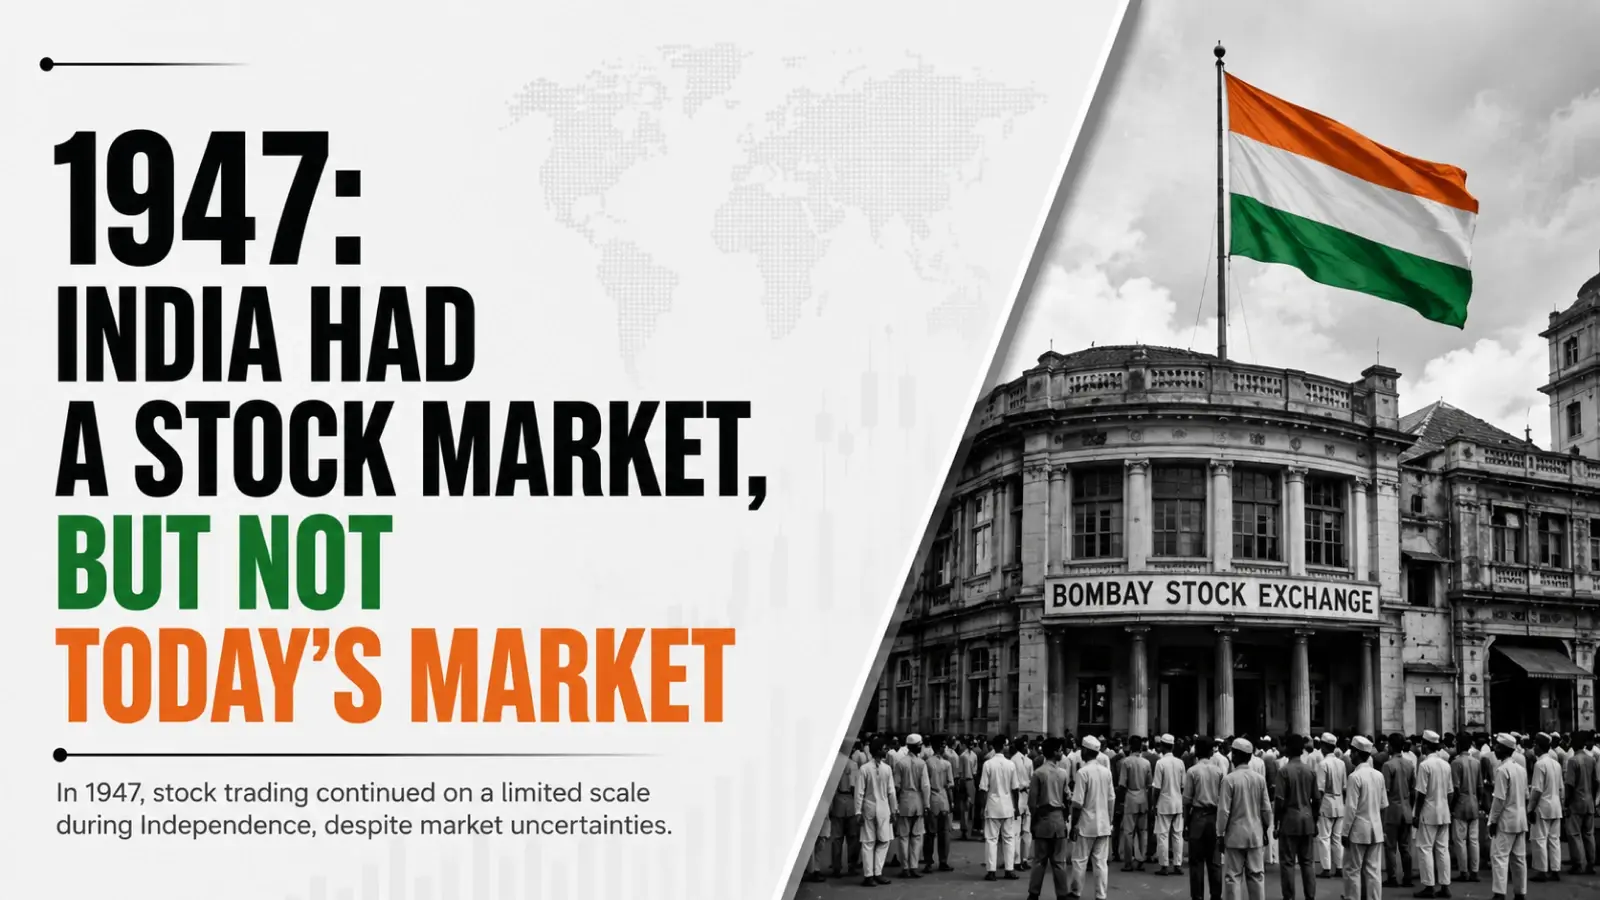

1947: India Had a Stock Market, But Not Today’s Market
When India became independent in 1947, organised securities trading was already decades old. The institution now known as the Bombay Stock Exchange traces its origins to July 9, 1875, when the Native Share & Stock Brokers’ Association was formed. The stock market therefore did not begin with Independence; rather, Independence placed an existing market inside a newly sovereign economy. BSE was granted permanent recognition under the Securities Contracts (Regulation) Act in 1957.
The market of the late 1940s was fundamentally different from the one that exists in 2026. Trading was conducted through physical processes, securities were represented by paper certificates, and brokers played a central role in bringing buyers and sellers together. There was no electronic order book, no dematerialised account, no internet trading platform and no mobile application connecting a household directly with an exchange.
The economic environment also placed substantial restrictions on the raising and allocation of capital. The Capital Issues (Control) Act, 1947 gave the government control over the issue of capital by companies. The framework was a continuation of wartime controls that had originally been introduced to direct resources towards national priorities. Companies therefore did not operate in the same capital-raising environment that exists after liberalisation.
This distinction is essential to understanding the next eight decades. India’s stock market did not simply become larger; the rules governing capital itself changed.
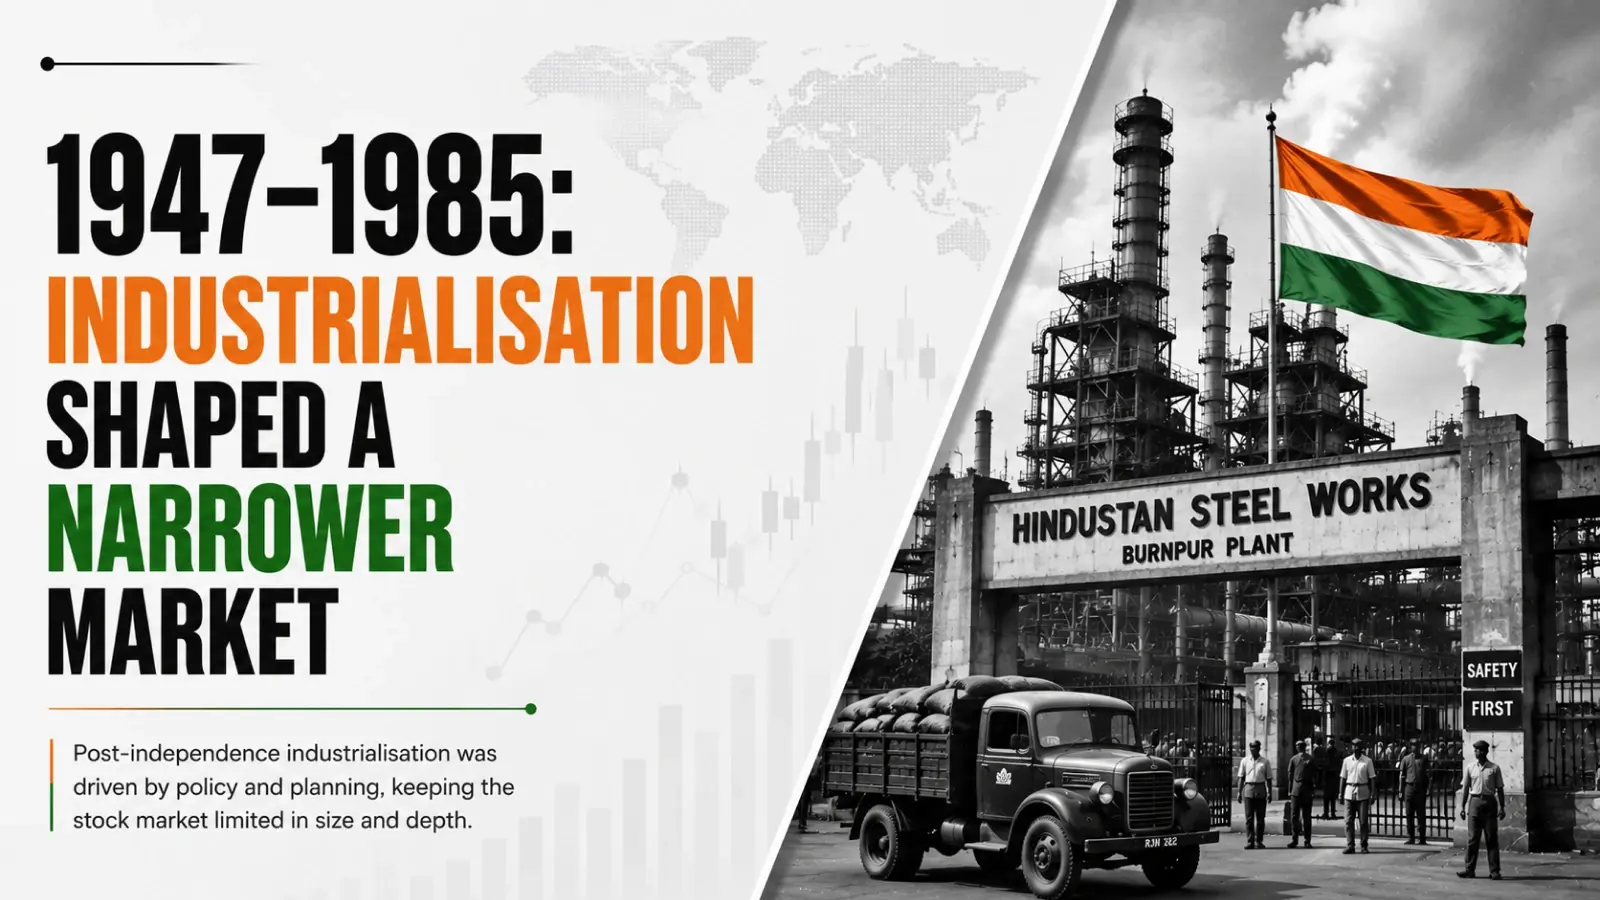
1947–1985: Industrialisation Shaped a Narrower Market
The decades following Independence were dominated by planned economic development, industrialisation and a large public-sector role. The government’s economic framework placed emphasis on national development priorities, industrial capacity and state participation. Bank nationalisation later expanded the public-sector presence in finance, while the licence-permit framework influenced how private companies expanded and invested.
For the stock market, this meant that listed companies operated within a highly regulated economic structure. Capital allocation was not determined solely by market prices, and companies faced restrictions that would later be dismantled during the reform process of the early 1990s.
Yet the period was also important because it created the industrial base that later became represented in listed equities. Manufacturing, engineering, metals, automobiles, energy and financial institutions gradually became important components of corporate India. The market therefore reflected an economy still focused heavily on building industrial capacity rather than one dominated by technology, consumer finance and digital services.
The contrast with 2026 is striking. India’s listed universe now spans information technology, banking, pharmaceuticals, telecommunications, consumer businesses, infrastructure, energy, manufacturing and digital services. The evolution of those sectors is one reason the stock market can be read as a history of India’s economic priorities.
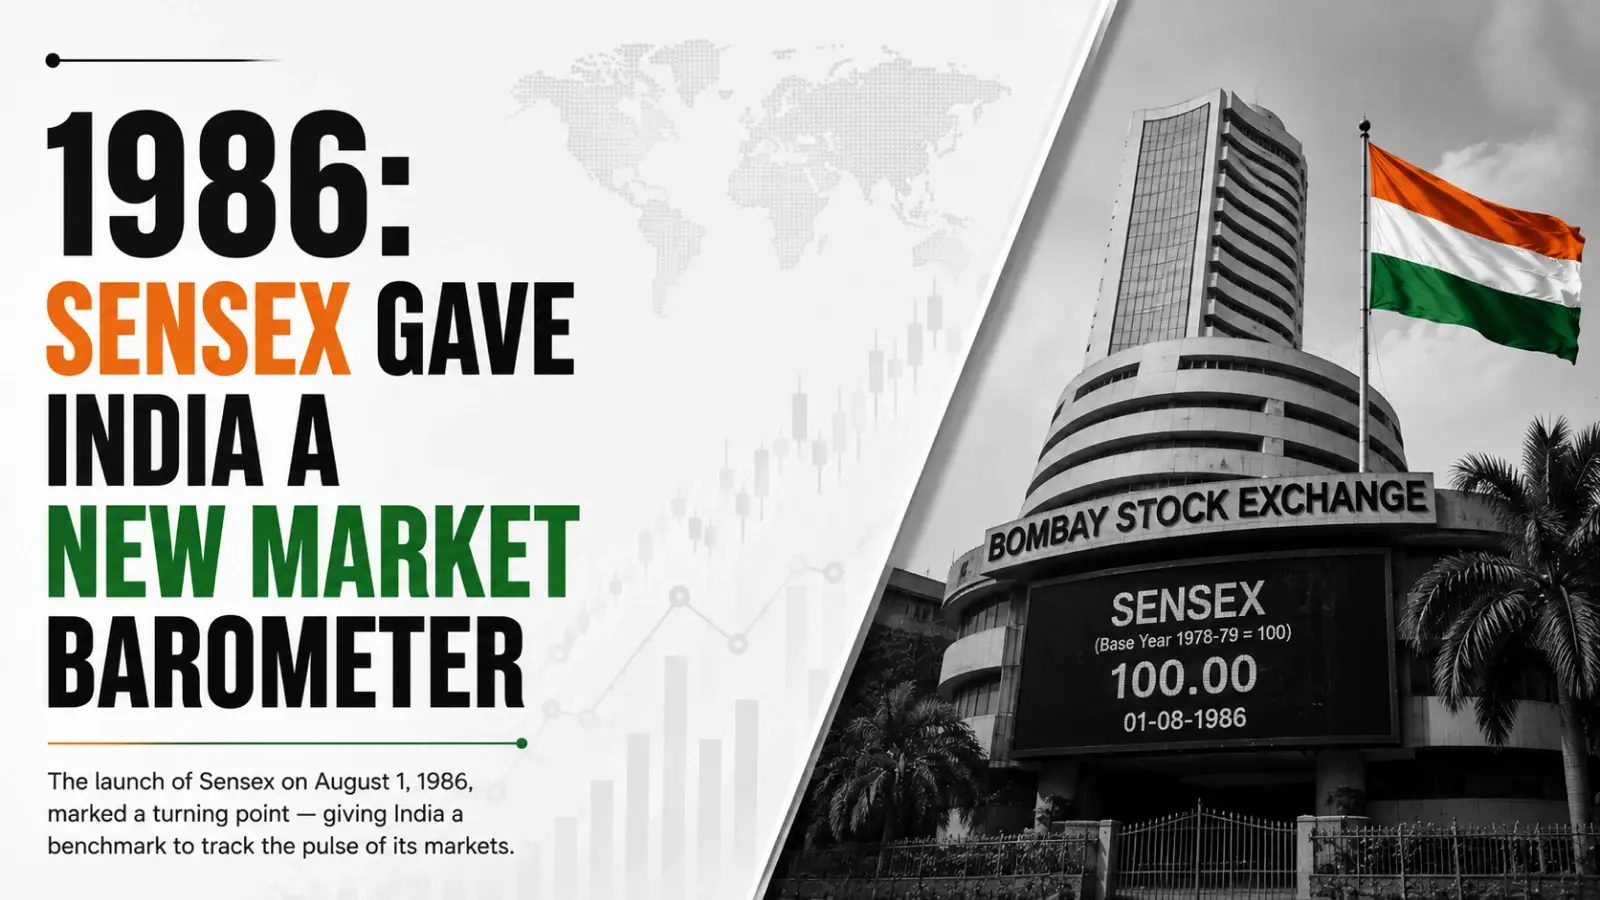
1986: Sensex Gave India a New Market Barometer
A major milestone arrived on January 2, 1986, when the BSE Sensex was launched as India’s first equity index. BSE’s historical material states that the index uses April 1, 1979 as its base date, with the base year 1978-79 and a base value of 100. The Sensex represents 30 large and financially strong companies through a market-capitalisation-weighted methodology.
The creation of the Sensex mattered because it gave India’s developing equity market a single numerical reference point. Instead of looking at individual share prices, market participants could track a benchmark representing a group of leading companies.
The companies represented in the index also mattered. They were not merely securities; collectively, they provided a snapshot of the corporate economy. As India’s economic structure changed, the sectors and companies represented in major benchmarks also changed.
The Sensex began its four-digit journey by closing at 1,001 in 1990. It then reached 2,020 in 1992, crossed 3,000 during that year and moved above 4,000, eventually closing 1992 at 4,091. The same year also demonstrated that market expansion could be accompanied by severe instability, as the Harshad Mehta securities scam led to a sharp reversal.
1991–1992: Liberalisation Rewrote the Capital-Market Rules
The most important structural change came with the economic reforms of 1991. The reform programme changed the relationship between government policy, private companies and capital markets. One of its most consequential effects on securities markets came in May 1992, when the Capital Issues (Control) Act was repealed and the Office of the Controller of Capital Issues was abolished. Companies gained freedom to raise capital at market-determined prices, subject to the emerging disclosure-based regulatory framework.
SEBI, the Securities and Exchange Board of India, had been established in 1988 under an administrative arrangement. The SEBI Act, 1992 gave it statutory powers. This created the institutional foundation for a market in which disclosure, regulation, transparency and investor protection became central elements.
Foreign capital also became an increasingly important part of the new market structure. SEBI data records FII investment beginning in 1992-93, with net investment of only ₹13 crore in that first financial year. It rose to ₹5,127 crore in 1993-94, ₹6,942 crore in 1995-96 and ₹10,122 crore in 1999-2000.
The significance was broader than the absolute amounts. Foreign institutional participation connected Indian equities with international pools of capital at a time when domestic companies were also gaining greater freedom to raise funds.
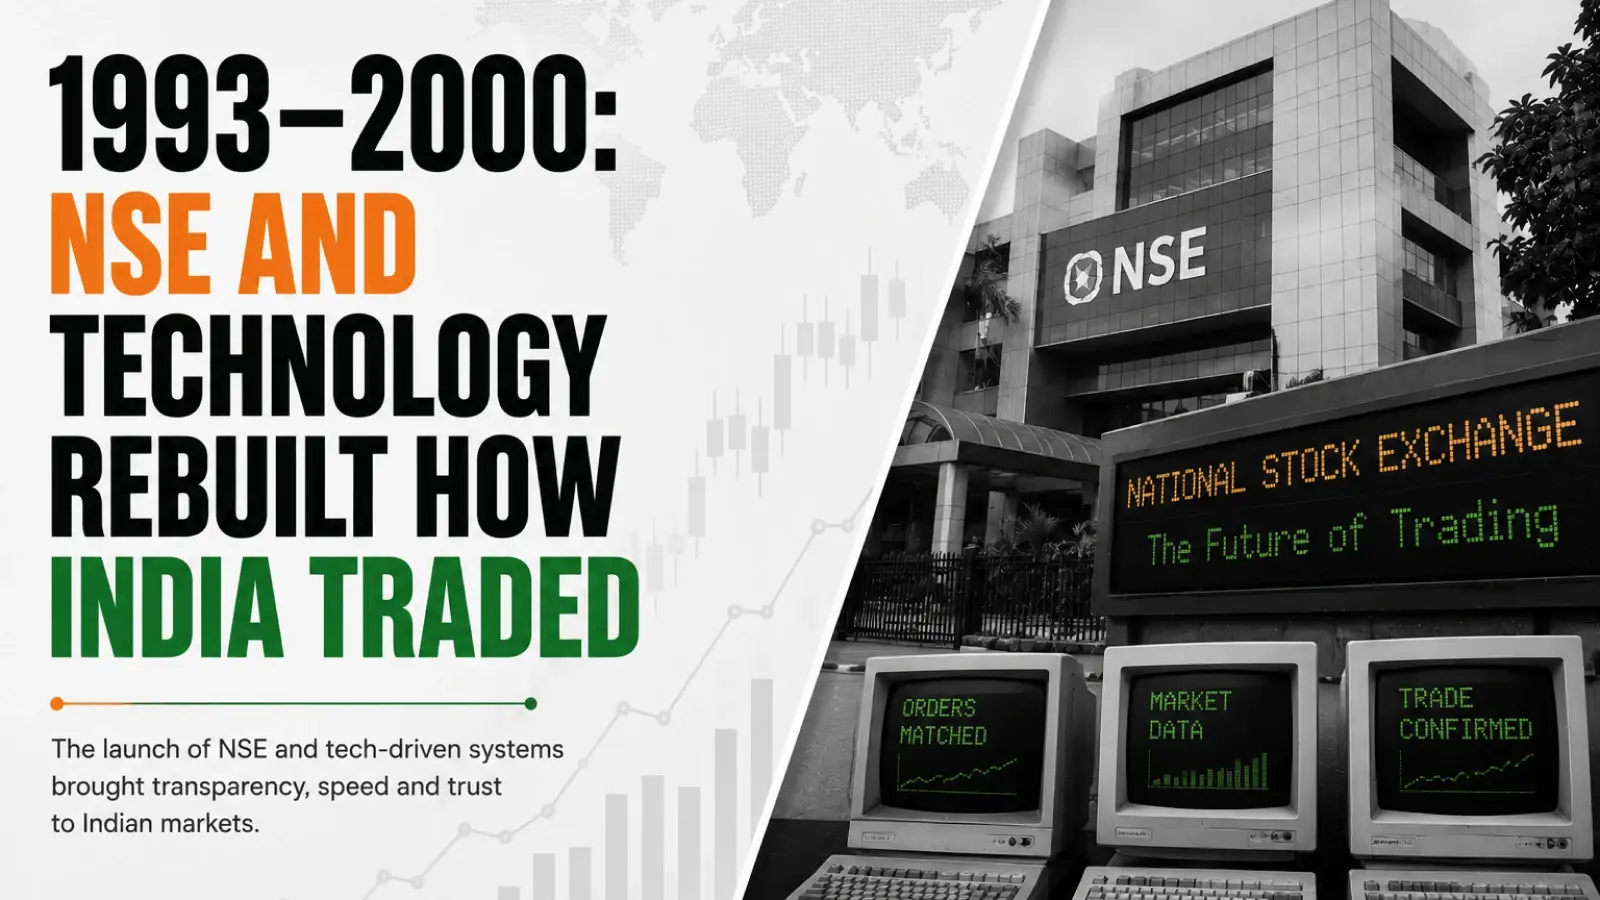
1993–2000: NSE and Technology Rebuilt How India Traded
The next transformation came through market infrastructure. The National Stock Exchange (NSE) was recognised in 1993, and its equity and wholesale debt-market segments were launched in 1993-94. Electronic or screen-based trading began in 1994, replacing the dependence on traditional open-outcry processes. NSE subsequently launched the Nifty 50 and commenced trading and settlement in dematerialised securities in 1995-96.
The changes altered the physical geography of trading. A market participant no longer needed to be physically present in Mumbai’s traditional trading environment to access an electronic market. The exchange itself became a technology platform capable of connecting participants across the country.
The move also strengthened transparency and efficiency. A government task-force report on securities-market reforms notes that the shift from open outcry to electronic order-book trading improved transparency, reduced spreads and lowered transaction costs. Between the end of March 1991 and March 2001, BSE market capitalisation rose from about ₹90,800 crore to ₹5.72 lakh crore.
Internet trading followed. SEBI approved the framework for internet-based trading in January 2000, allowing client orders to be routed electronically to exchange trading systems through brokers’ internet platforms. NSE became the first exchange to approve members for internet-based trading services.
The physical market was therefore beginning to disappear even before the smartphone era arrived.
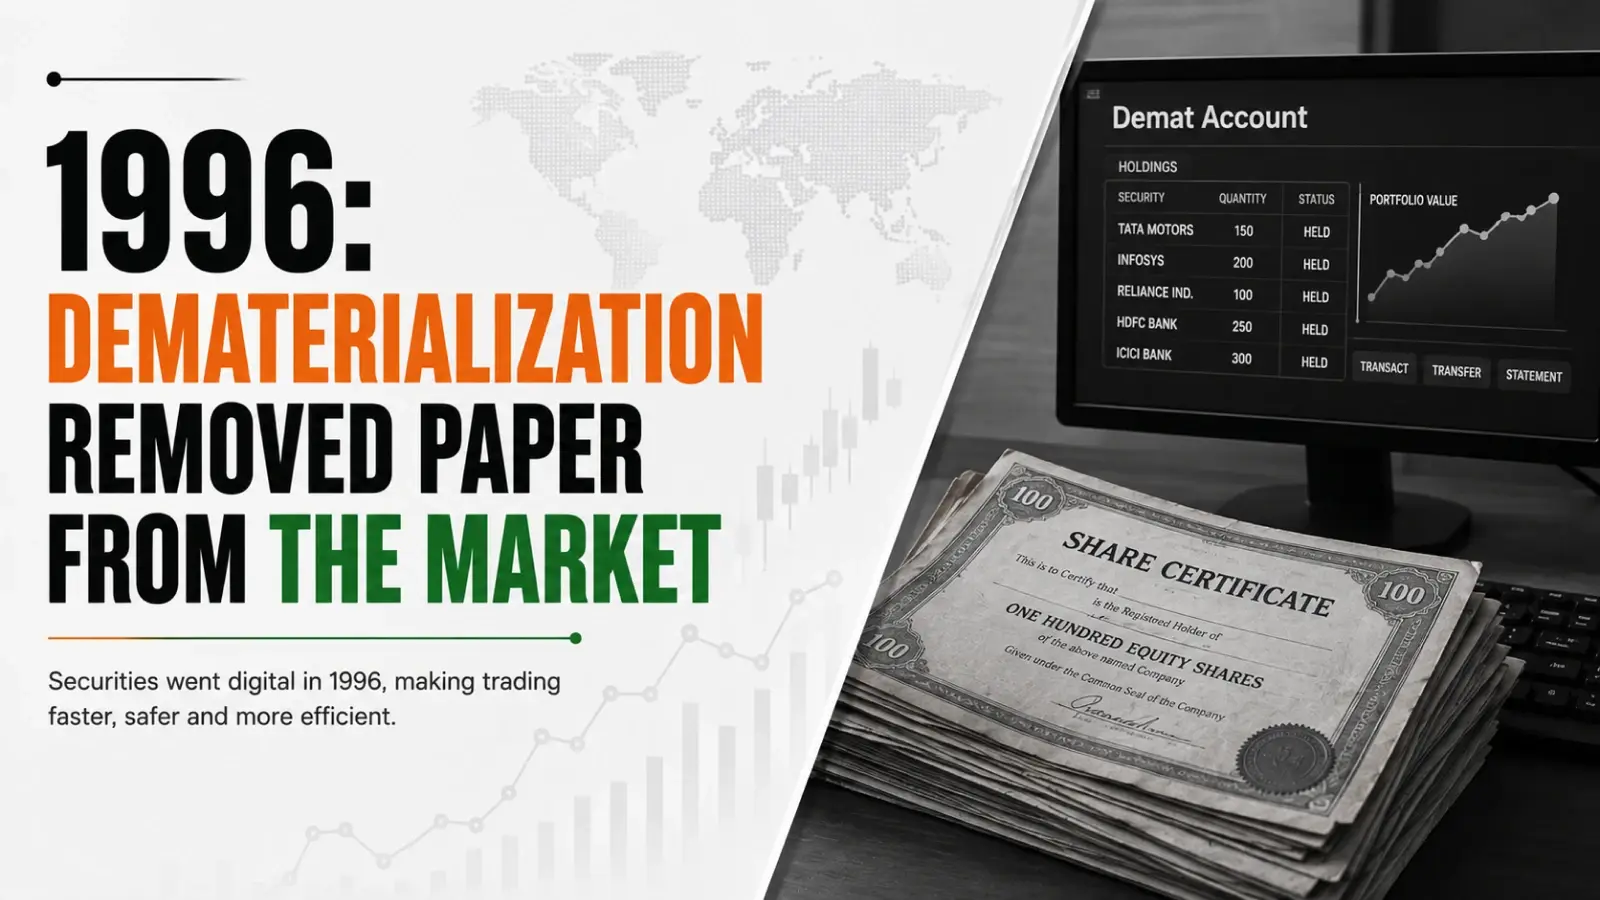
1996: Dematerialisation Removed Paper from the Market
The Depositories Act, 1996 provided the legal foundation for holding securities electronically. NSDL became India’s first depository, while dematerialised settlement became part of the NSE system during 1995-96. The change addressed practical problems associated with paper certificates, including loss, theft, forgery, mutilation, delays in transfer and bad deliveries.
Dematerialisation was one of the least visible but most consequential transformations in India’s capital markets. It changed the basic unit of ownership. A share no longer needed to exist as a physical document held by an individual; ownership could be recorded electronically.
That development eventually made the digital-investor revolution possible. Without electronic ownership, internet trading, mobile applications and the rapid expansion of retail participation would have faced a fundamentally different infrastructure.
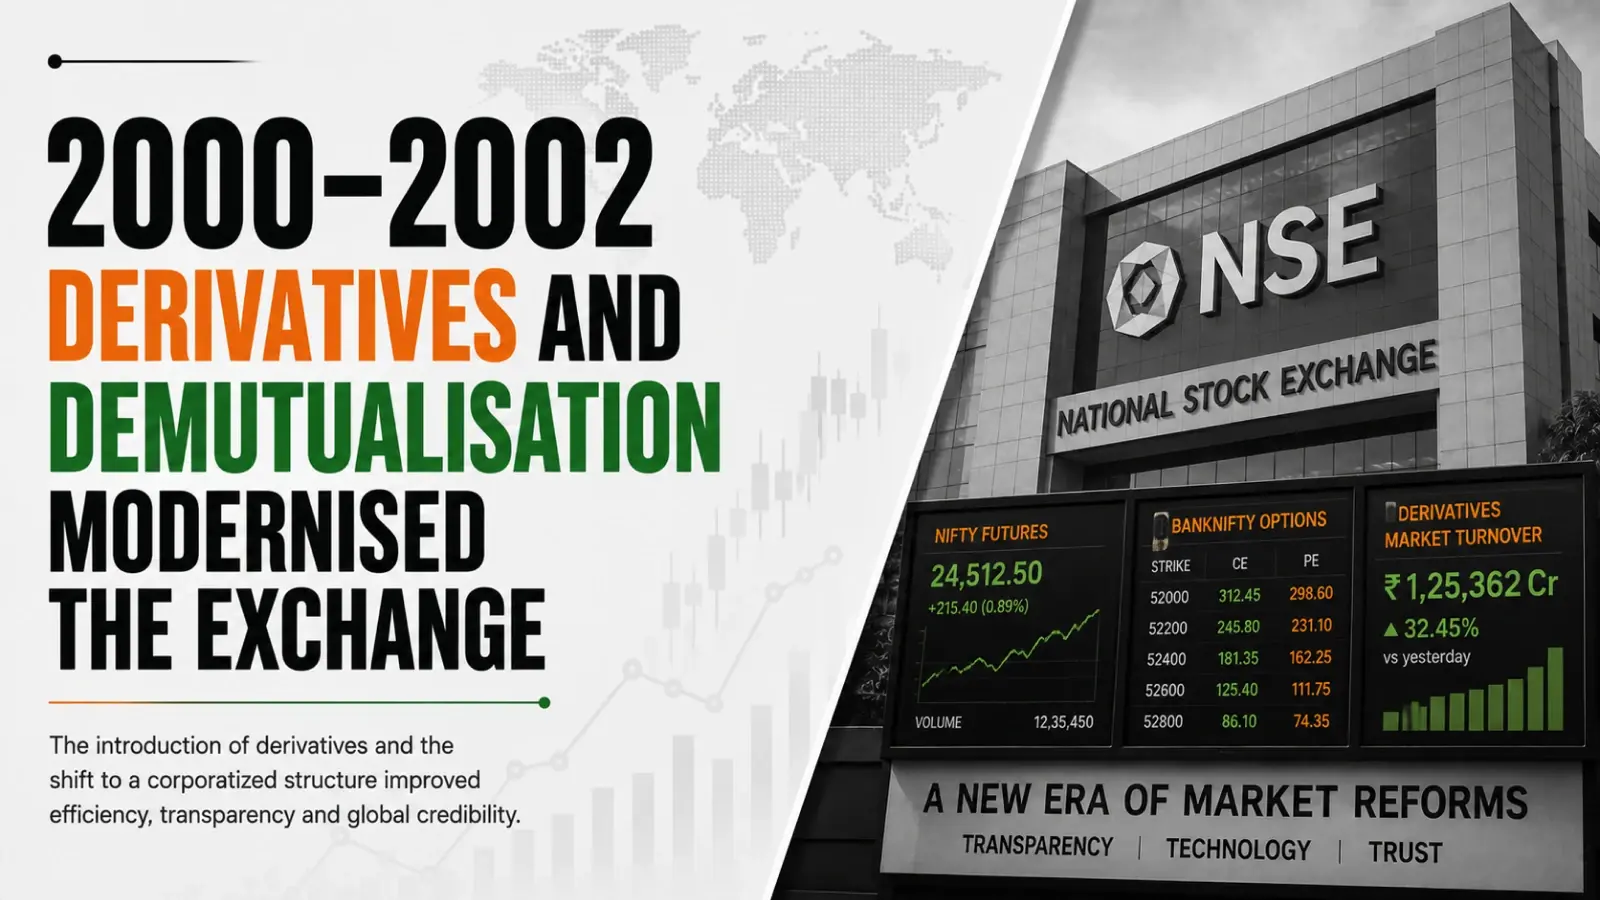
2000–2002: Derivatives and Demutualisation Modernised The Exchange
The early 2000s brought another series of structural changes. NSE launched index options, single-stock futures and options between 2000 and 2001, expanding the market beyond cash-equity trading. The period also brought major changes to the ownership and governance structure of India’s exchanges. The BSE Corporatisation and Demutualisation Scheme was approved in 2005, separating ownership, management and trading rights and completing the transformation of the historic exchange from an association of brokers into a corporatised entity.”
BSE had already introduced its BSE On-Line Trading system, or BOLT, in 1995, replacing the outdated open outcry system and enhancing speed and efficiency. In 2001, BSE launched BSEWEBX.com, the world’s first centralized exchange-based internet trading system, allowing global investors remote access to Indian markets, marking BSE’s global push.
The significance of these changes was institutional. India’s exchanges were becoming technology-led market infrastructure institutions rather than traditional associations centred on physical broker communities.
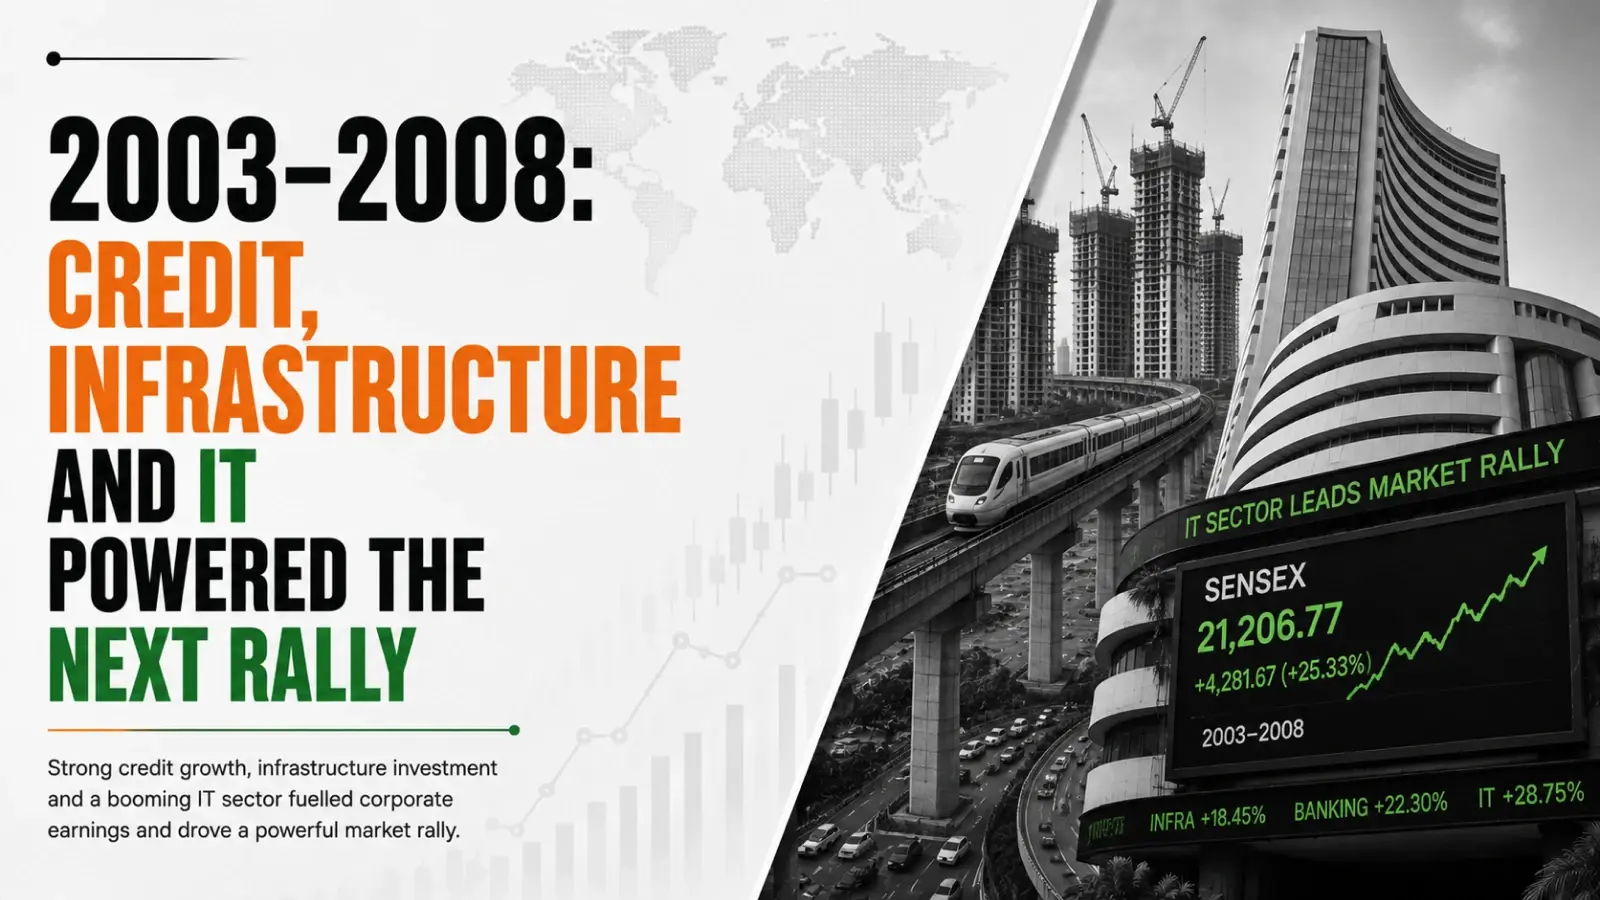
2003–2008: Credit, Infrastructure and IT Powered the Next Rally
The period from 2003 to 2008 was one of the most powerful growth phases in India’s modern market history. Multiple economic engines operated simultaneously: corporate investment increased, bank credit expanded, infrastructure spending accelerated, information technology companies became global businesses, consumption strengthened and foreign capital inflows increased.
SEBI’s historical data shows BSE market capitalisation rising from ₹12.01 lakh crore in 2003-04 to ₹51.38 lakh crore in 2007-08. Over the same period, the annual-average Sensex increased from 4,492 to 16,569.
Foreign portfolio participation also expanded sharply. Net FII investment rose from ₹2,689 crore in 2002-03 to ₹45,765 crore in 2003-04, ₹45,881 crore in 2004-05, ₹41,467 crore in 2005-06 and ₹66,179 crore in 2007-08.
The economic composition of India’s market was changing accordingly. Industrial companies benefited from investment and infrastructure activity; banks represented expanding credit and financial intermediation; technology companies reflected India’s growing role in global services; and consumer companies increasingly represented the expansion of household purchasing power.
This was the period when India’s stock market increasingly became a reflection of a rapidly expanding corporate economy rather than simply a collection of traditional industrial businesses.
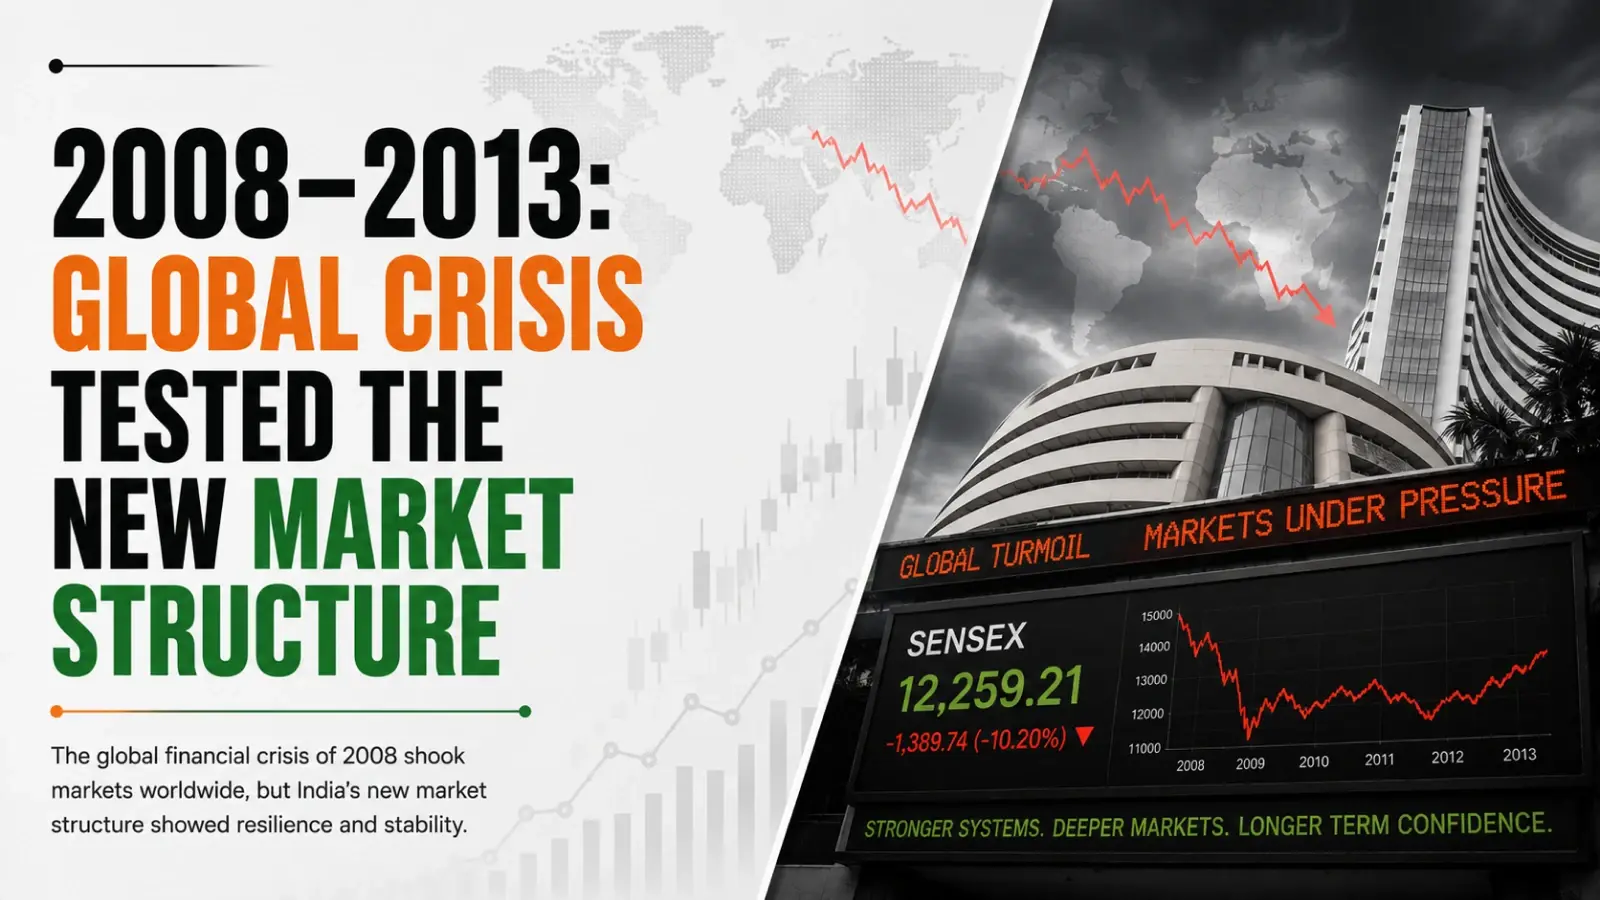
2008–2013: Global Crisis Tested the New Market Structure
The global financial crisis of 2008 interrupted that expansion. BSE market capitalisation fell from ₹51.38 lakh crore in 2007-08 to ₹30.86 lakh crore in 2008-09, while the annual-average Sensex declined from 16,569 to 12,366.
Foreign flows showed the external shock particularly clearly. FII investment, which had been a net inflow of ₹66,179 crore in 2007-08, turned into a net outflow of ₹45,811 crore in 2008-09. In the following financial year, net FII investment rebounded to ₹1.43 lakh crore.
The episode demonstrated how closely India’s increasingly globalised capital market had become linked to international financial conditions. At the same time, the market’s ability to recover highlighted the growing depth of domestic institutions, corporate activity and financial infrastructure.
The period that followed was characterised by greater importance for banking, infrastructure, consumption and services. India’s economy was no longer represented by a narrow industrial base; listed businesses increasingly captured the country’s transition towards a more diversified services- and consumption-driven economy.
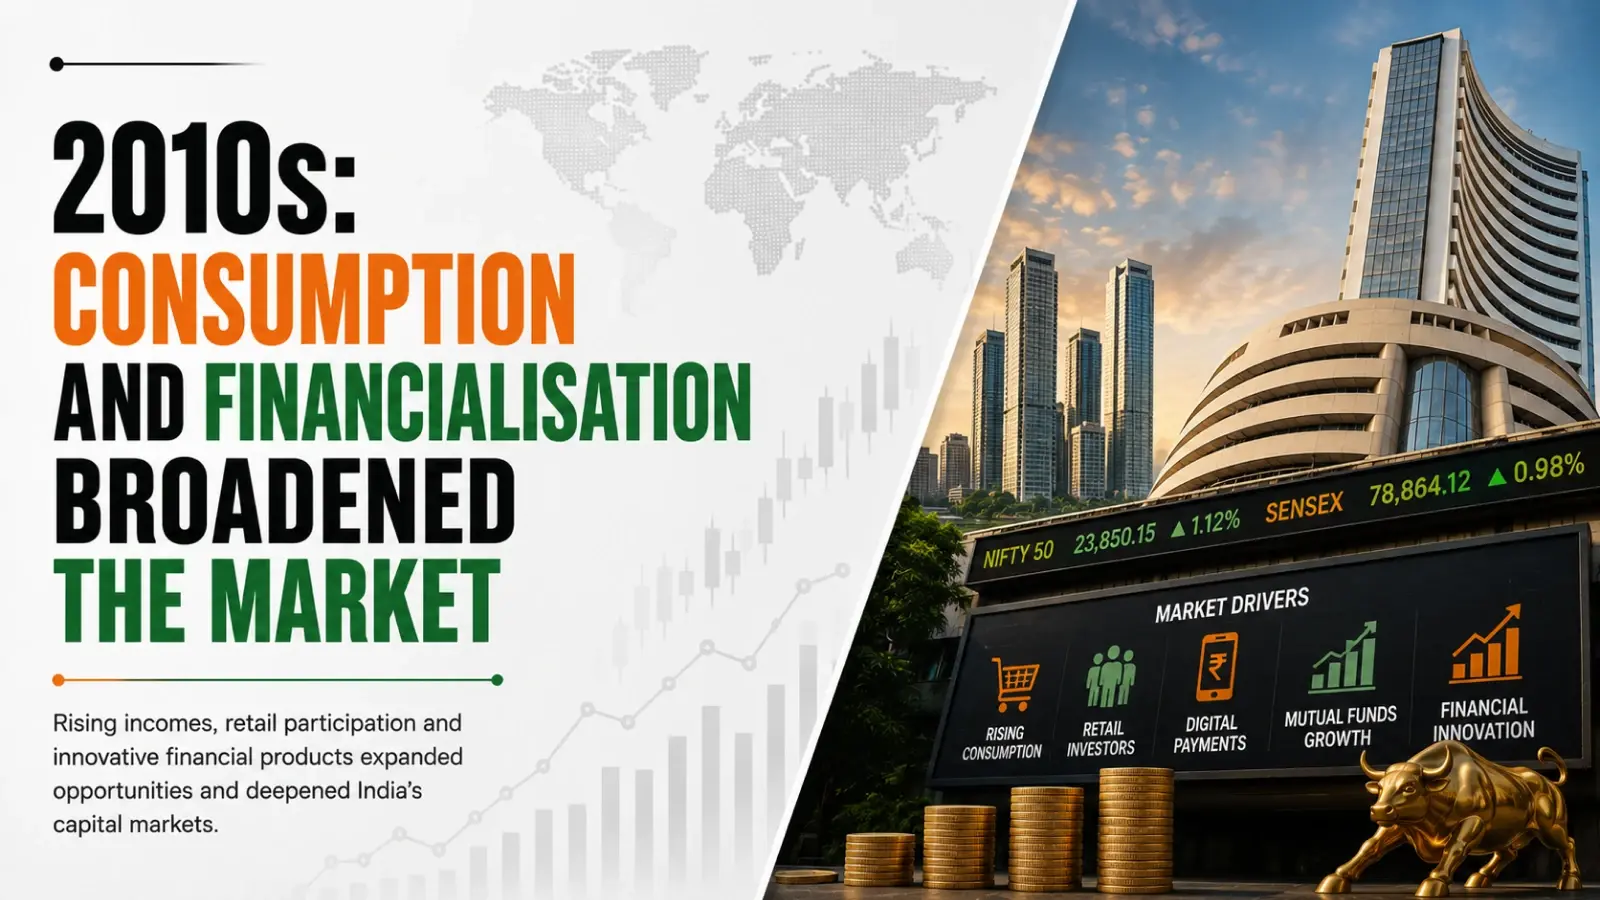
2010s: Consumption and Financialisation Broadened the Market
The 2010s added another layer to India’s market story: the financialisation of household savings. Mutual funds, systematic investment plans, demat accounts and online investment platforms gradually became more important channels for household participation.
The growth in mutual funds illustrates the scale of this change. SEBI says industry assets under management increased from about ₹12 trillion in FY16 to over ₹81 trillion by early 2026. Average monthly SIP contributions during FY26 through December reached ₹285 billion, compared with ₹77 billion in FY19, representing an increase of more than 3.7 times.
AMFI’s latest June 2026 data puts mutual-fund industry AUM at ₹82.22 trillion, compared with ₹13.81 trillion in June 2016, a roughly six-fold increase over ten years. The industry had 27.86 crore folios in June 2026, including about 21.23 crore folios in equity, hybrid and solution-oriented schemes where retail participation is significant.
This did not mean households had stopped using traditional savings instruments. Rather, the financial system had expanded to include a larger range of financial assets and channels.
The RBI’s household-financial-savings data shows the continuing scale of household financial accumulation. For 2023-24, households recorded net financial assets of about ₹15.52 lakh crore, while financial assets during the year were about ₹34.31 lakh crore. The data includes bank deposits, insurance, provident and pension funds, mutual funds, equity and small savings.
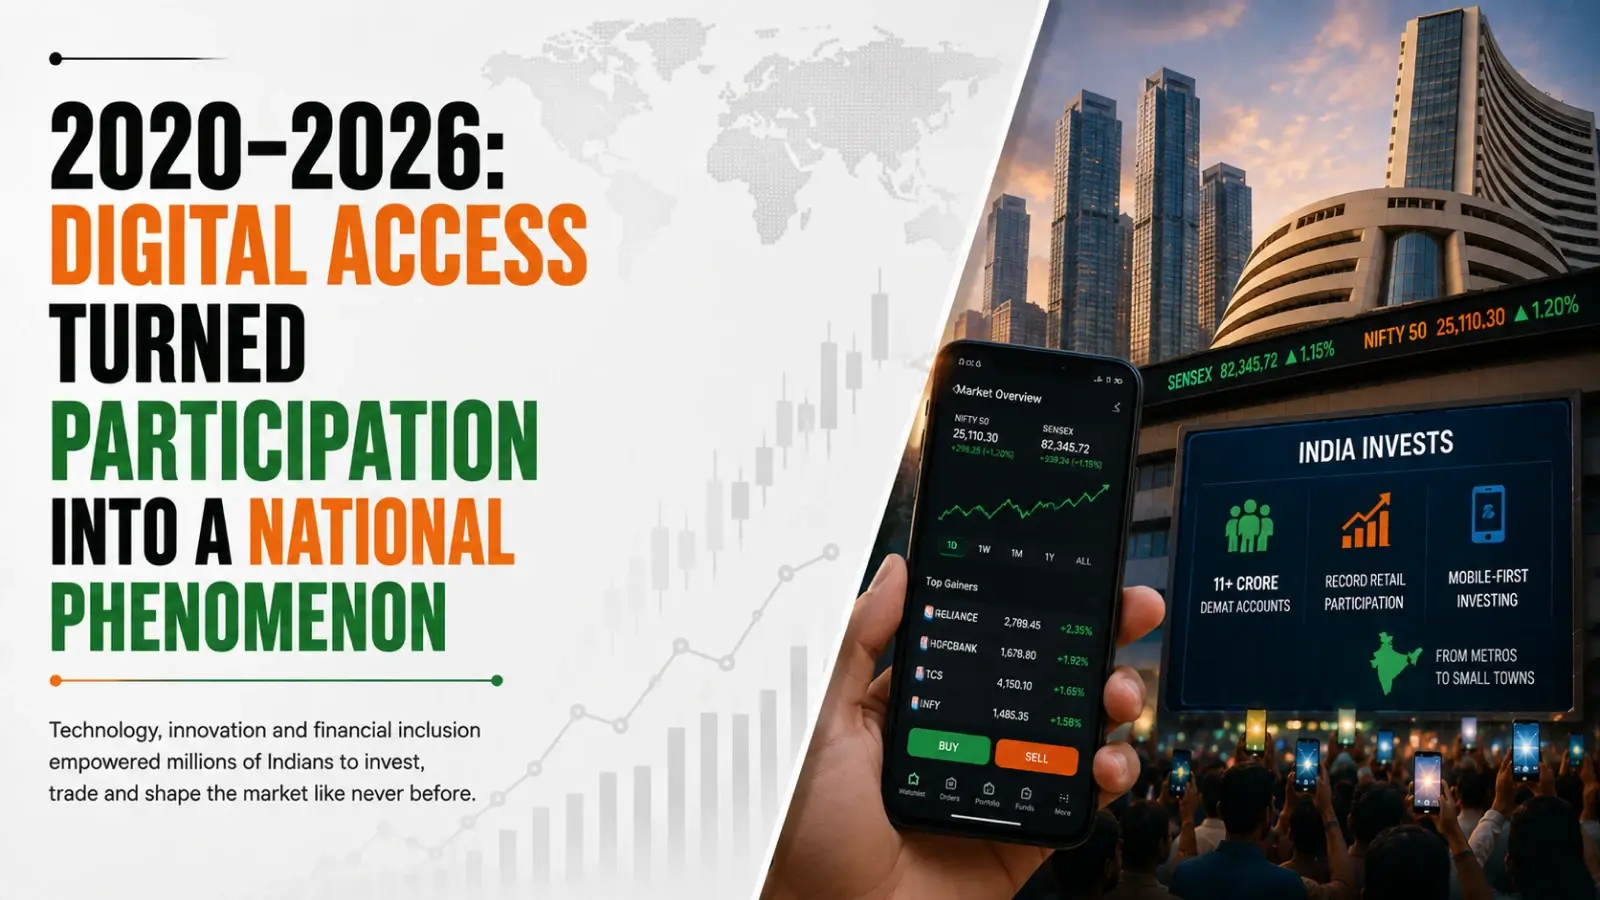
2020–2026: Digital Access Turned Participation into a National Phenomenon
The COVID-19 shock in 2020 became another defining moment. India’s market infrastructure operated through a period of exceptional disruption, while digital access to financial services continued to expand.
By March 2019, India had about 3.8 crore unique investors and 3.6 crore demat accounts. By February 2026, SEBI said unique investors had reached about 13.9 crore, while demat accounts had crossed 21 crore. In June 2026, the SEBI Chairman put the number of securities-market investors at around 145 million.
These figures must be distinguished because a person can have more than one demat account, while unique-investor measures attempt to identify individuals rather than accounts. The growth nevertheless shows the scale of the structural change.
The expansion was also geographical. SEBI has described market participation as moving beyond metropolitan centres into cities, towns and smaller regions. The market was becoming more national in character rather than being concentrated in traditional financial centres.
The transformation from physical certificates in 1947 to digital holdings in 2026 therefore involved several distinct stages: expanding exchanges in the 1980s, SEBI’s statutory framework in 1992, dematerialisation in the mid-1990s, internet trading from 2000, mobile and web-based access in the following decades, and large-scale retail participation in the 2020s.
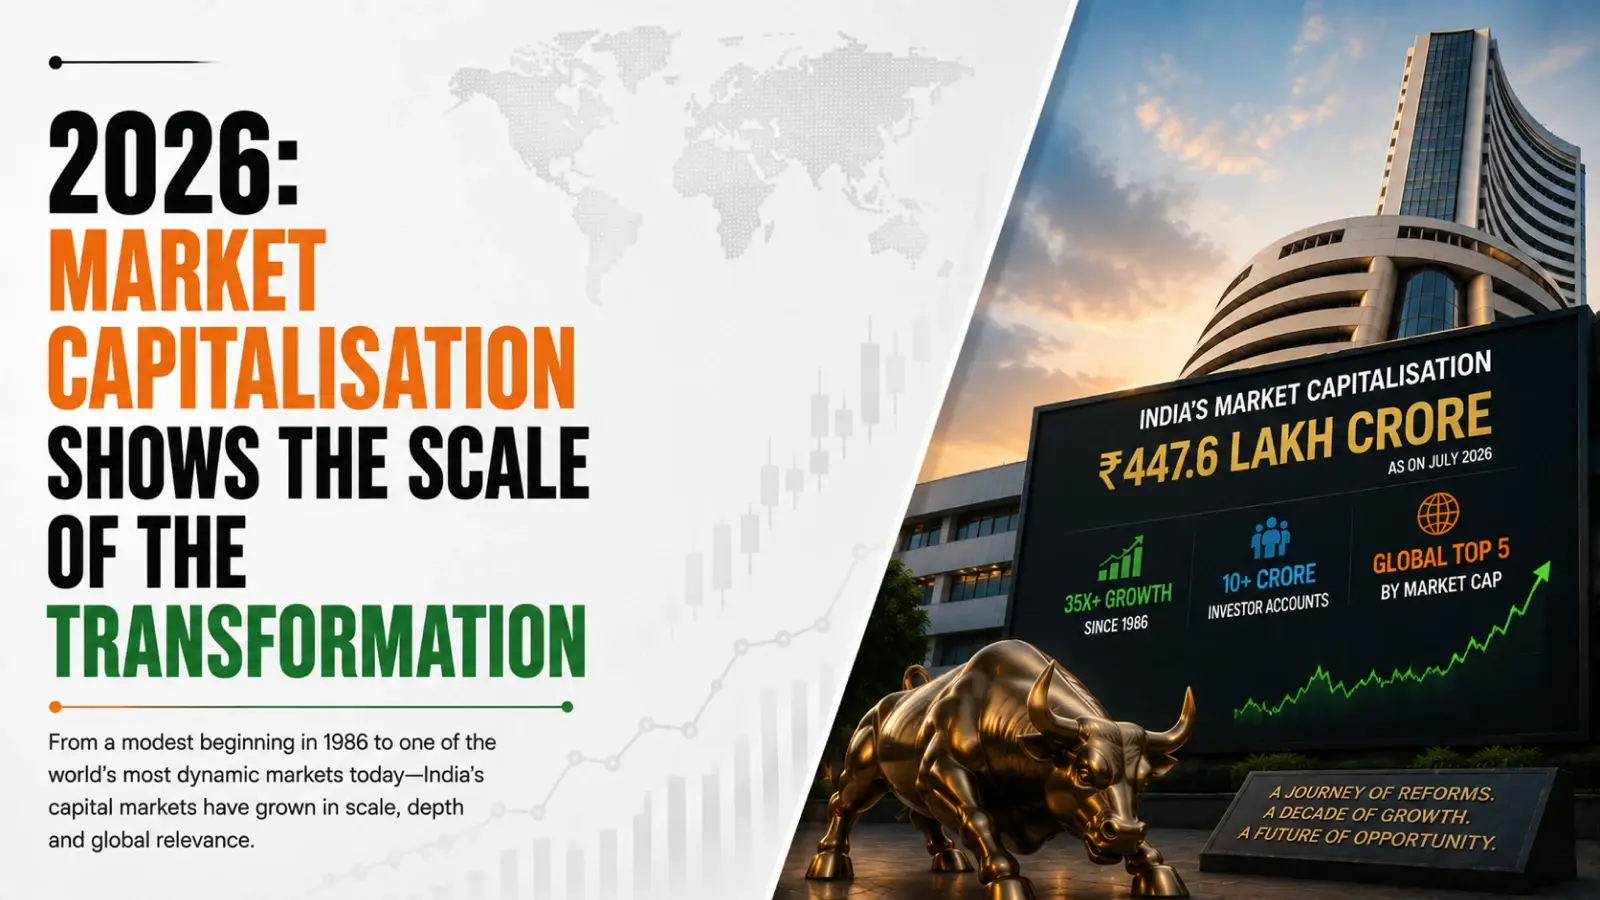
2026: Market Capitalisation Shows the Scale of the Transformation
The size of India’s listed market provides another measure of the country’s transformation. SEBI says market capitalisation increased from around ₹100 trillion in FY15 to more than ₹470 trillion by early 2026. As a share of GDP, it rose from about 81% in FY15 to 138%. A later June 2026 address put the market-capitalisation-to-GDP ratio at about 128%, reflecting differences in the measurement date.
India’s nominal GDP has also expanded substantially. World Bank data puts India’s GDP at about US$321 billion in 1990, US$468 billion in 2000, US$2.29 trillion in 2016 and approximately US$3.96 trillion in 2025.
The comparison illustrates why market capitalisation alone does not tell the complete story. The expansion of listed equity occurred alongside a much larger economy, a wider corporate sector, greater foreign participation and deeper household involvement in financial markets.
Capital raising has expanded as well. SEBI reported that equity issuance crossed ₹4.5 trillion in FY26, with 366 IPOs raising about ₹1.9 trillion, while corporate bond issuance exceeded ₹9 trillion.
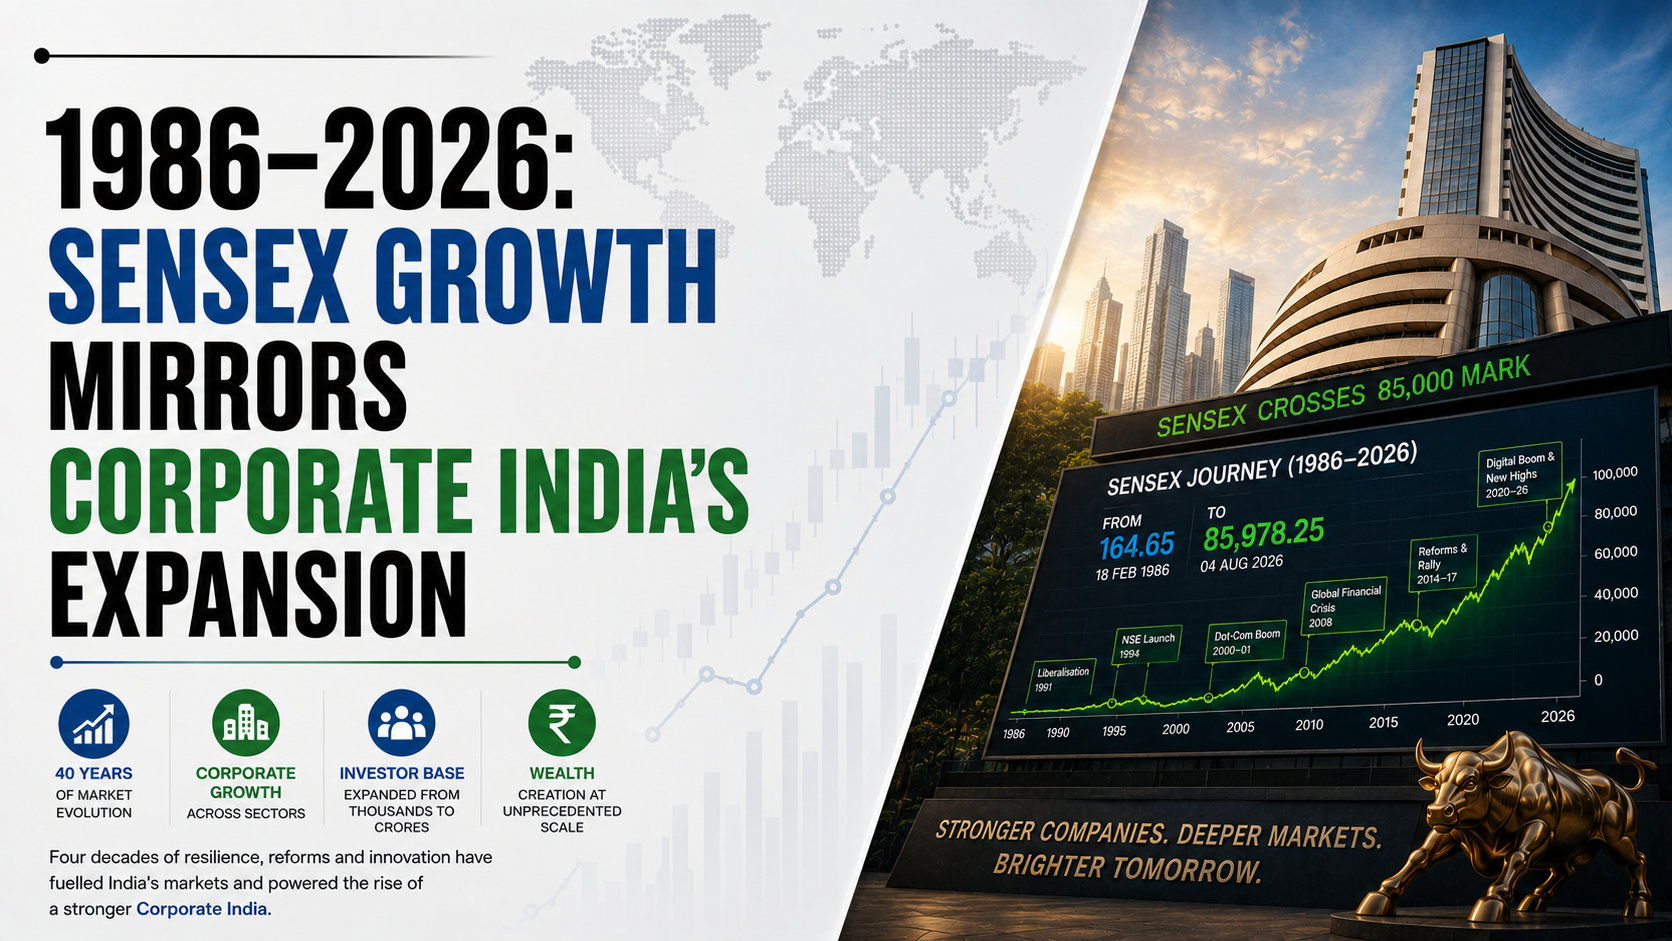
1986–2026: Sensex Growth Mirrors Corporate India’s Expansion
The Sensex’s numerical journey captures four decades of market development. Its base is 100, its historical base date is April 1, 1979, and BSE began publishing it in 1986. It reached 1,001 in 1990, 2,020 in 1992, crossed 3,000 and 4,000 during 1992, and closed that year at 4,091.
By 2026, the index was operating around the 77,000–78,000 range. On August 13, 2026, the Sensex closed at 78,079.96, and on the morning of August 14, it was around 77,820.91 as higher crude prices and geopolitical concerns weighed on the market.
The significance of moving from a base of 100 to tens of thousands is not simply the size of the number. The index’s underlying corporate economy has changed. The companies represented in India’s leading benchmarks now span private banks, information technology, energy, automobiles, pharmaceuticals, consumer businesses and other sectors that were either smaller or less prominent in earlier decades.
10 Businesses Show How India’s Economy Changed
India’s economic transformation can be understood not only through the Sensex but also through the businesses that came to represent successive stages of development. The companies that dominate India’s market today operate in industries that were either much smaller or structured very differently in the early decades after Independence. Their evolution reflects the movement from industrialisation and state-led development towards private enterprise, technology, financialisation, mass consumption, infrastructure and digital services.
Tata Group represents India’s industrialisation and the development of large Indian enterprises. Tata Steel, Tata Motors and Tata Power connect the stock-market story to steel, automobiles, energy and industrial infrastructure. These businesses provide a link between the manufacturing base built during India’s earlier development phase and the diversified corporate economy of today.
Reliance Industries represents the expansion of private-sector enterprise. Its evolution from petrochemicals and refining into telecommunications, retail and digital services mirrors the widening opportunities available to large private businesses after economic liberalisation. NSE data shows Reliance’s market capitalisation increasing from around ₹75,132 crore in FY04 to nearly ₹20 lakh crore in FY24, making it the largest company in the top-10 market-capitalisation ranking in both periods.
Tata Consultancy Services and Infosys represent India’s technology revolution and services exports. Their rise captures the transition from an economy dominated by physical production towards one in which software and technology-enabled services became major sources of corporate growth and global revenue. Infosys was among the top companies in NSE’s FY04, FY14 and FY24 comparisons, while TCS entered the top 10 by FY14 and remained among the largest companies in FY24.
State Bank of India, ICICI Bank and HDFC Bank represent financialisation. SBI connects today’s market with India’s long history of public-sector banking, while ICICI Bank and HDFC Bank reflect the expansion of modern private-sector banking following the financial reforms of the 1990s. Their growing importance mirrors the increasing role of formal credit, banking, savings and investment in the economy.
ITC and Hindustan Unilever represent rising mass consumption. Their businesses connect listed companies with changing household demand, urbanisation and the expansion of consumer markets. Both have remained important companies in NSE’s historical comparison of India’s largest listed businesses.
Larsen & Toubro represents infrastructure and capital expenditure, linking the stock market with India’s investment in engineering, construction and large-scale infrastructure. Bharti Airtel represents telecommunications and digitalisation, capturing the transition from limited telecommunications access to nationwide digital connectivity. Maruti Suzuki represents mass automobile ownership and manufacturing, showing how industrial production increasingly became connected to rising household consumption. Sun Pharmaceutical Industries represents specialised manufacturing and pharmaceuticals, reflecting India’s emergence as an important producer of medicines and healthcare products.
Taken together, these businesses provide a different way to read India’s stock-market history. Tata represents industrialisation; Reliance private-sector expansion; TCS and Infosys technology; banks financialisation; ITC and HUL consumption; L&T infrastructure; Airtel digitalisation; Maruti mass mobility; and Sun Pharma specialised manufacturing. They are therefore not being presented as the “best-performing stocks”, but as corporate markers of the economic changes that have shaped independent India.
NSE data shows the scale of that transformation. The combined market capitalisation of India’s top 10 companies rose from approximately ₹3 lakh crore in FY04 to ₹22 lakh crore in FY14 and ₹89 lakh crore in FY24. At the same time, their share of the overall market declined from nearly 50% to about 23%, indicating that the broader listed corporate universe expanded considerably.
Seven Market Cycles Show What Powered India’s Rallies
India’s major bull-market phases can broadly be connected to different economic engines. The industrialisation period was associated with the creation of manufacturing capacity and large domestic enterprises. The 1991 reforms opened a new phase in which private enterprise and market-based capital allocation gained importance. The technology boom demonstrated India’s ability to build globally competitive services businesses.
The 2003–2008 cycle was powered by a combination of credit growth, infrastructure investment, corporate capital expenditure, foreign capital and strong economic expansion. The post-2008 period increasingly brought banking, consumption and services into focus. The 2010s saw financialisation and mutual funds expand the channels through which households participated in markets. The 2020s added digital access, mass demat ownership and broader retail participation.
The latest phase has also placed greater emphasis on manufacturing, electronics, infrastructure, energy transition and digital public infrastructure. SEBI’s June 2026 address noted that roads, railways, ports, airports, telecom connectivity, data centres, electronics supply chains, semiconductor manufacturing and battery storage were becoming important building blocks of the economy.
From Foreign Capital to Household Capital, Ownership Has Broadened
Foreign capital was one of the defining changes after liberalisation. SEBI’s historical records show that cumulative FII investment crossed US$10 billion in December 1999, while net FII investment in 1999-2000 reached ₹10,121.93 crore. By the mid-2000s, annual inflows were measured in tens of thousands of crores, with net investment reaching ₹66,179 crore in 2007-08 before the global financial crisis reversed the flow.
But India’s capital market is no longer defined only by overseas participation. SEBI says individuals and mutual funds together now own around 21% of listed equity, while mutual-fund assets have risen to around 23% of GDP, compared with about 9% in FY15.
That represents one of the biggest structural differences between the India of the early post-Independence decades and the India of 2026: a much larger portion of domestic savings can now reach capital markets through formal financial channels.
The stock market’s eight-decade journey broadly mirrors India’s economic transformation—from a controlled capital-allocation system at Independence through industrialisation, the 1986 Sensex, 1991 reforms, SEBI, NSE, electronic trading and dematerialisation, to foreign capital, technology, credit, infrastructure, consumption, mutual funds, SIPs and digital investing. The Sensex’s rise from its 100-point historical base to 77,000–78,000 in 2026 reflects a larger corporate sector, deeper capital markets and wider participation, making the market a record of India’s economic change.
Source
- https://www.bseindia.com/static/about/History.aspx
- https://www.bseindia.com/static/about/Indices.aspx
- https://www.bseindia.com/static/about/introduction.aspx
- https://www.nseindia.com/static/about-nse/our-history
- https://www.nseindia.com/static/nifty50-turns-25
- https://www.nseindia.com/all-reports
- https://www.nseindia.com/resources/historical-reports-capital-market-daily-monthly-archives
- https://www.sebi.gov.in/
- https://www.sebi.gov.in/legal/acts/july-1992/securities-and-exchange-board-of-india-act-1992_11582.html
- https://www.sebi.gov.in/legal/acts/may-1992/capital-issues-control-act-1947_11630.html
- https://www.sebi.gov.in/sebi_data/attachdocs/dec-2021/1639386893965.pdf
- https://www.sebi.gov.in/reports-and-statistics/publications/aug-2026/SEBI%20ANNUAL%20REPORT%202025_26.pdf
- https://www.nsdl.co.in/about/index.php
- https://www.nsdl.co.in/services/demat.php
- https://www.amfiindia.com/research-information/aum-data/average-aum
- https://www.amfiindia.com/research-information/other-data/monthly
- https://www.rbi.org.in/Scripts/AnnualReportPublications.aspx
- https://www.rbi.org.in/Scripts/PublicationsView.aspx?id=22696
- https://databank.worldbank.org/reports.aspx?country=IND&series=NY.GDP.MKTP.CD&source=2
- https://nsearchives.nseindia.com/web/sites/default/files/inline-files/Market%20Pulse_March%202025.pdf
Disclaimer
If you have any concerns, questions, or wish to point out any discrepancies in our content, please feel free to write to us at content@hdfcsec.com.
Please Note: The information shared is intended solely for informational purposes and does not make any investment recommendations
Disclaimer
At HDFC SKY*, we take utmost care and due diligence in curating and presenting news and market-related content. However, inadvertent errors or omissions may occasionally occur.
If you have any concerns, questions, or wish to point out any discrepancies in our content, please feel free to write to us at content@hdfcsec.com.
Please Note: The information shared is intended solely for informational purposes and does not make any investment recommendations.
HDFC SKY from HDFC Securities, one of most trusted trading platforms in India, has been recognized with the *Next-Gen Digi Content Awards 2025-26.
 Join Us
 Add as preferred source on Google


More Business News







Open Free Demat Account
Open Free Demat Account










Invest Anytime, Anywhere


By signing up I certify terms, conditions & privacy policy