Nifty 50
- Apollo Hospitals₹8,027.50361.50 (4.72%)
- BSE₹3,287.20-47.60 (-1.43%)
- ITC₹26611.00 (4.31%)
- Reliance Industries₹1,170.30-7.70 (-0.65%)
- Eicher Motors₹7,050282.50 (4.17%)
- JSW Steel₹1,168-7.20 (-0.61%)
- TCS₹2,15680.00 (3.85%)
- Cipla₹1,301-5.80 (-0.44%)
- HCL Technologies₹1,216.7039.80 (3.38%)
- Adani Ports₹1,76153.00 (3.10%)
- Infosys₹1,023.4026.40 (2.65%)
- Shriram Finance₹940.4523.20 (2.53%)
- Tata Motors PV₹279.906.90 (2.53%)
- UltraTech Cement₹10,675249.00 (2.39%)

- Offerings
- Tools & Platforms
Tools & Calculators
- Open API
- Calculators
- SIP Calculator
- CAGR Calculator
- Compound Interest Calculator
- FD Calculator
- RD Calculator
- EPF Calculator
- Retirement Calculator
- HDFC SIP Calculator
- Mutual Fund Return Calculator
- Lumpsum Calculator
- Step Up SIP Calculator
- ETF SIP Calculator
- Brokerage Calculator
- Equity Margin Calculator
- SWP Calculator
- EMI Calculator
- MTF Calculator
- Margin Pledge Calculator
- Algo Strategy
- Markets
Stocks
F&O
Mutual Funds
- More
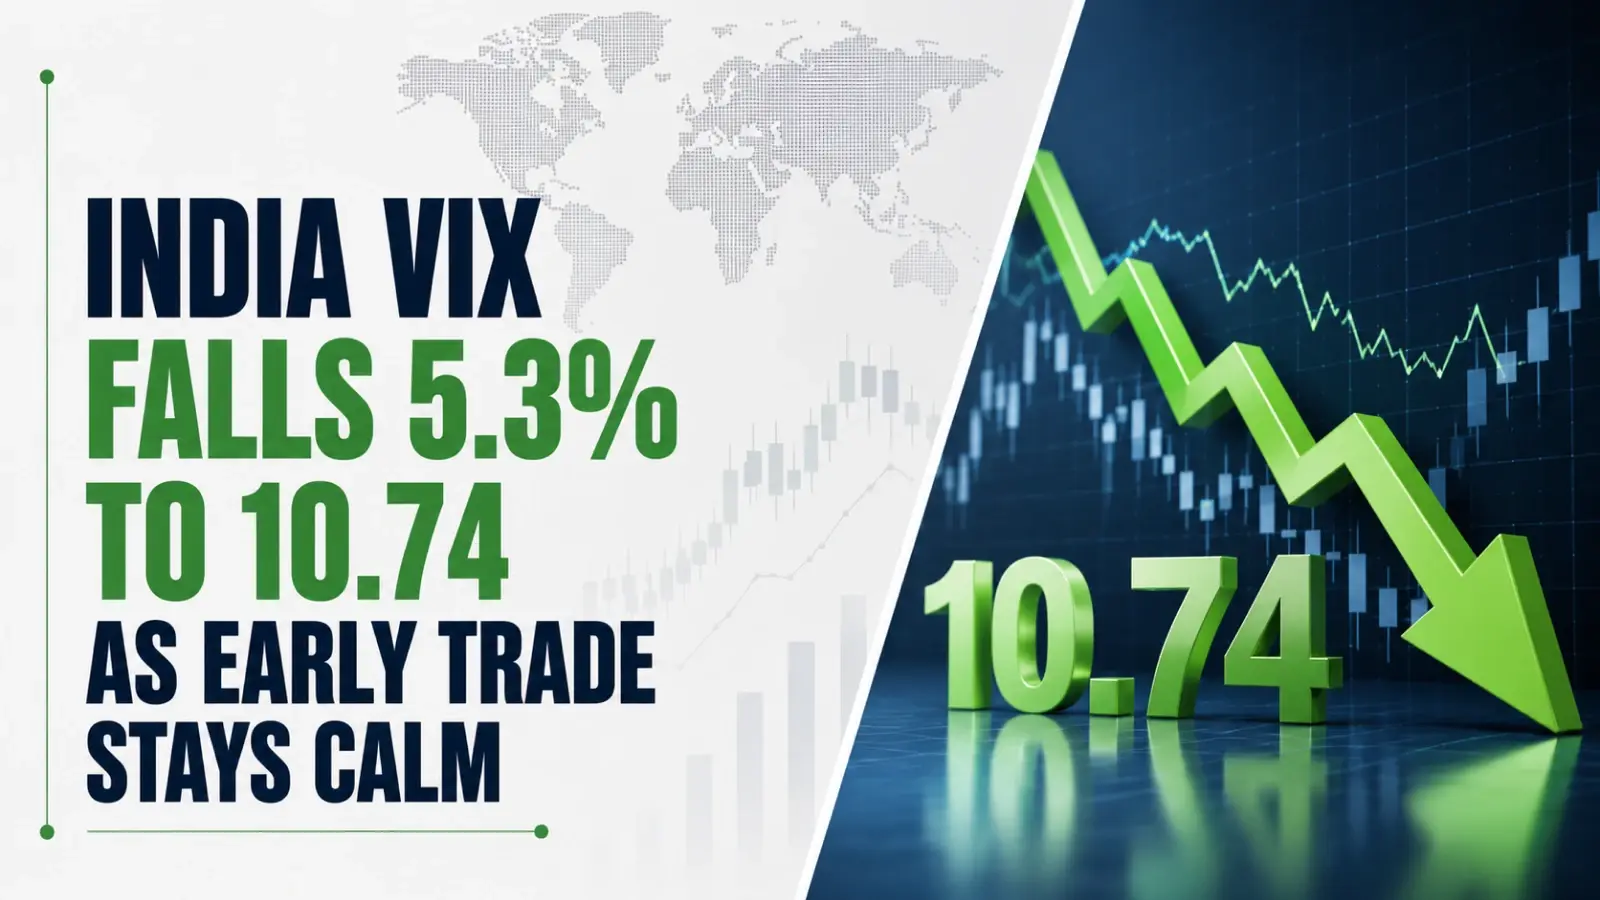
India VIX Falls 5.3% to 10.74 as Early Trade Stays Calm
Authored By HDFC SKY | Last Modified: Aug 20, 2026 11:24 AM IST
Open Free Demat Account
Open Free Demat Account
Mumbai, Aug 20: India VIX declined 0.60 points, or 5.3%, to 10.74 by 10:18 IST on Thursday, signalling a softer volatility reading during the opening and early trading session. The index opened at 11.32, matching its previous close, before moving within a 9.33–11.32 day range. The early movement came as the broader market assessed the latest domestic and global cues, while India VIX remained well below its 52-week high of 28.90 and above its 52-week low of 8.72.

India VIX at 10.74 as Early Volatility Remains Contained
The fall in India VIX came despite the index beginning the session at 11.32, the same level as its previous close. During early trade, the index moved lower within its reported intraday range, with the day low at 9.33 and the day high at 11.32. By 10:18 IST, India VIX stood at 10.74, down 5.3%.
The movement indicates that the volatility gauge remained contained during the opening phase rather than extending towards its 52-week peak. India VIX measures expected market volatility, making its movement an important indicator of how sharply near-term fluctuations are being priced into the market.
The index’s broader performance also remains measured against its 52-week range of 8.72 to 28.90. Its reported YTD return is 13.29%, showing that Thursday’s decline is taking place within a broader year-to-date period of positive performance. At 10.74, India VIX remains 2.02 points above its 52-week low of 8.72 and 18.16 points below its 52-week high of 28.90.
August Seasonality Shows 9.91% Average Change Over 18 Years
Historical August data provides additional context for Thursday’s movement. India VIX has recorded positive returns in 12 out of 18 years during August. The month has registered a maximum positive change of 68.84% in 2015, while its average positive change has been 18.10%. On the negative side, the maximum decline was 11.26% in 2016, with an average negative change of 6.47%.
The seasonality data shows an average August change of 9.91%. However, these historical figures do not alter the current-session reading, which is based on the index’s opening and early-session movement on 20 August.
Classic Pivots Put 11.03 as Key Reference for the Session
The day’s technical reference levels place the Classic pivot at 11.03, with resistance levels at 12.01, 12.69 and 13.67, while support levels are positioned at 10.35, 9.37 and 8.69.
The Fibonacci method places the pivot at 11.03, followed by resistance levels of 11.67, 12.06 and 12.69, with supports at 10.40, 10.01 and 9.37. Under the Camarilla method, the pivot remains 11.03, with resistance at 11.47, 11.62 and 11.78, and support levels at 11.17, 11.02 and 10.86.
These levels are calculated from the previous trading day’s price range and provide the session’s stated support and resistance references.
Neutral Technical Trend Keeps India VIX Direction Unchanged
The technical rating for India VIX remains NEUTRAL on the daily timeframe. The available technical panel does not provide values for moving averages, technical indicators or moving-average crossovers.
The neutral rating therefore accompanies Thursday’s lower early-session reading without establishing a directional technical trend. India VIX remains within its wider 8.72–28.90 52-week range, while the day’s movement has so far remained inside the reported 9.33–11.32 range.
10.74 Reading Comes as August Volatility Data Stays Positive
The current 10.74 reading needs to be viewed alongside the index’s August seasonality rather than in isolation. Historical data shows that August has produced positive India VIX returns in 12 of 18 years, with an average change of 9.91%.
At the same time, the month’s historical performance has included substantial movements in both directions. The strongest positive change recorded was 68.84% in 2015, compared with a maximum negative change of 11.26% in 2016. The average positive and negative changes stand at 18.10% and -6.47%, respectively.
These figures describe historical August movements and do not indicate the direction of the index for the remainder of the current month.
9.33–11.32 Range Defines Thursday’s Early Trading Movement
The immediate session data shows India VIX trading between 9.33 and 11.32, with the index at 10.74 as of 10:18 IST. The opening level was 11.32, while the previous close was also 11.32, leaving the initial reference point unchanged before the index moved lower.
The difference between the day’s high and low is 1.99 points, keeping the reported early-session movement within a relatively defined range. The 5.3% decline by 10:18 IST represents the principal change in the index during the period covered by the supplied data.
8.72–28.90 Range Puts Current VIX Near Its Lower Band
India VIX’s current reading remains substantially below its 52-week high of 28.90. At 10.74, the index is also above its 52-week low of 8.72, placing the latest level closer to the lower end of its annual range.
The index’s 13.29% YTD return provides the broader performance context, while Thursday’s 5.3% early-session decline represents the latest daily movement. The supplied data does not provide a separate one-week, one-month, three-month, six-month or one-year return figure, so no additional performance figure is assigned to those periods.
11.03 Pivot Separates the Session’s Main Support and Resistance Levels
The three technical approaches supplied for Thursday all use 11.03 as the central pivot. Classic analysis places the first resistance at 12.01 and first support at 10.35. Fibonacci levels put those references at 11.67 and 10.40, while Camarilla calculations show 11.47 and 11.17.
With India VIX at 10.74 at 10:18 IST, the index was below the central 11.03 pivot across all three methodologies. The reported session data therefore places the latest reading alongside the day’s stated technical reference levels rather than above the central pivot.
India VIX stood at 10.74, down 5.3%, at 10:18 IST on 20 August 2026, after opening at 11.32. The index traded between 9.33 and 11.32, while its technical trend remained NEUTRAL. The 11.03 pivot and 8.72–28.90 52-week range provide the supplied technical and historical context for Thursday’s early movement.
Source
- https://www.nseindia.com/reports-indices-historical-vix
Disclaimer
If you have any concerns, questions, or wish to point out any discrepancies in our content, please feel free to write to us at content@hdfcsec.com.
Please Note: The information shared is intended solely for informational purposes and does not make any investment recommendations
HDFC SKY, one of India’s most trusted trading platforms, has been recognized with the Next-Gen Digi Content Awards 2025–26.
Disclaimer
At HDFC SKY*, we take utmost care and due diligence in curating and presenting news and market-related content. However, inadvertent errors or omissions may occasionally occur.
If you have any concerns, questions, or wish to point out any discrepancies in our content, please feel free to write to us at content@hdfcsec.com.
Please Note: The information shared is intended solely for informational purposes and does not make any investment recommendations.
HDFC SKY from HDFC Securities, one of most trusted trading platforms in India, has been recognized with the *Next-Gen Digi Content Awards 2025-26.
 Join Us
 Add as preferred source on Google


More Business News








Open Free Demat Account
Open Free Demat Account











Invest Anytime, Anywhere


By signing up I certify terms, conditions & privacy policy