Nifty 50
- Bajaj Auto₹10,050272.00 (2.78%)
- Tech Mahindra₹1,469.60-44.50 (-2.94%)
- Dr. Reddy's Labs₹1,226.5029.50 (2.46%)
- ITC₹258.70-7.30 (-2.74%)
- Mahindra & Mahindra₹2,830.6034.40 (1.23%)
- SBI₹939.55-19.55 (-2.04%)
- Eicher Motors₹7,11868.00 (0.96%)
- Bharti Airtel₹1,772.70-32.40 (-1.79%)
- BSE₹3,316.8029.60 (0.90%)
- Hindustan Unilever₹1,826.30-30.40 (-1.64%)
- Bharat Electronics₹370.702.55 (0.69%)
- NTPC₹306.95-5.05 (-1.62%)
- HDFC Life Insurance ₹560.403.75 (0.67%)
- L&T₹3,645.60-57.70 (-1.56%)
- JSW Steel₹1,173.505.50 (0.47%)
- Coal India₹405.35-6.20 (-1.51%)
- Eternal₹324.901.45 (0.45%)
- ICICI Bank₹1,335-20.00 (-1.48%)
- UltraTech Cement₹10,72247.00 (0.44%)
- Nestle₹1,320.80-12.20 (-0.92%)

- Offerings
- Tools & Platforms
Tools & Calculators
- Open API
- Calculators
- SIP Calculator
- CAGR Calculator
- Compound Interest Calculator
- FD Calculator
- RD Calculator
- EPF Calculator
- Retirement Calculator
- HDFC SIP Calculator
- Mutual Fund Return Calculator
- Lumpsum Calculator
- Step Up SIP Calculator
- ETF SIP Calculator
- Brokerage Calculator
- Equity Margin Calculator
- SWP Calculator
- EMI Calculator
- MTF Calculator
- Margin Pledge Calculator
- Algo Strategy
- Markets
Stocks
F&O
Mutual Funds
- More
India VIX Opens Flat at 12.24 as Volatility Remains Contained in Early Trade
Authored By HDFC SKY | Last Modified: Aug 11, 2026 11:04 AM IST
Open Free Demat Account
Open Free Demat Account
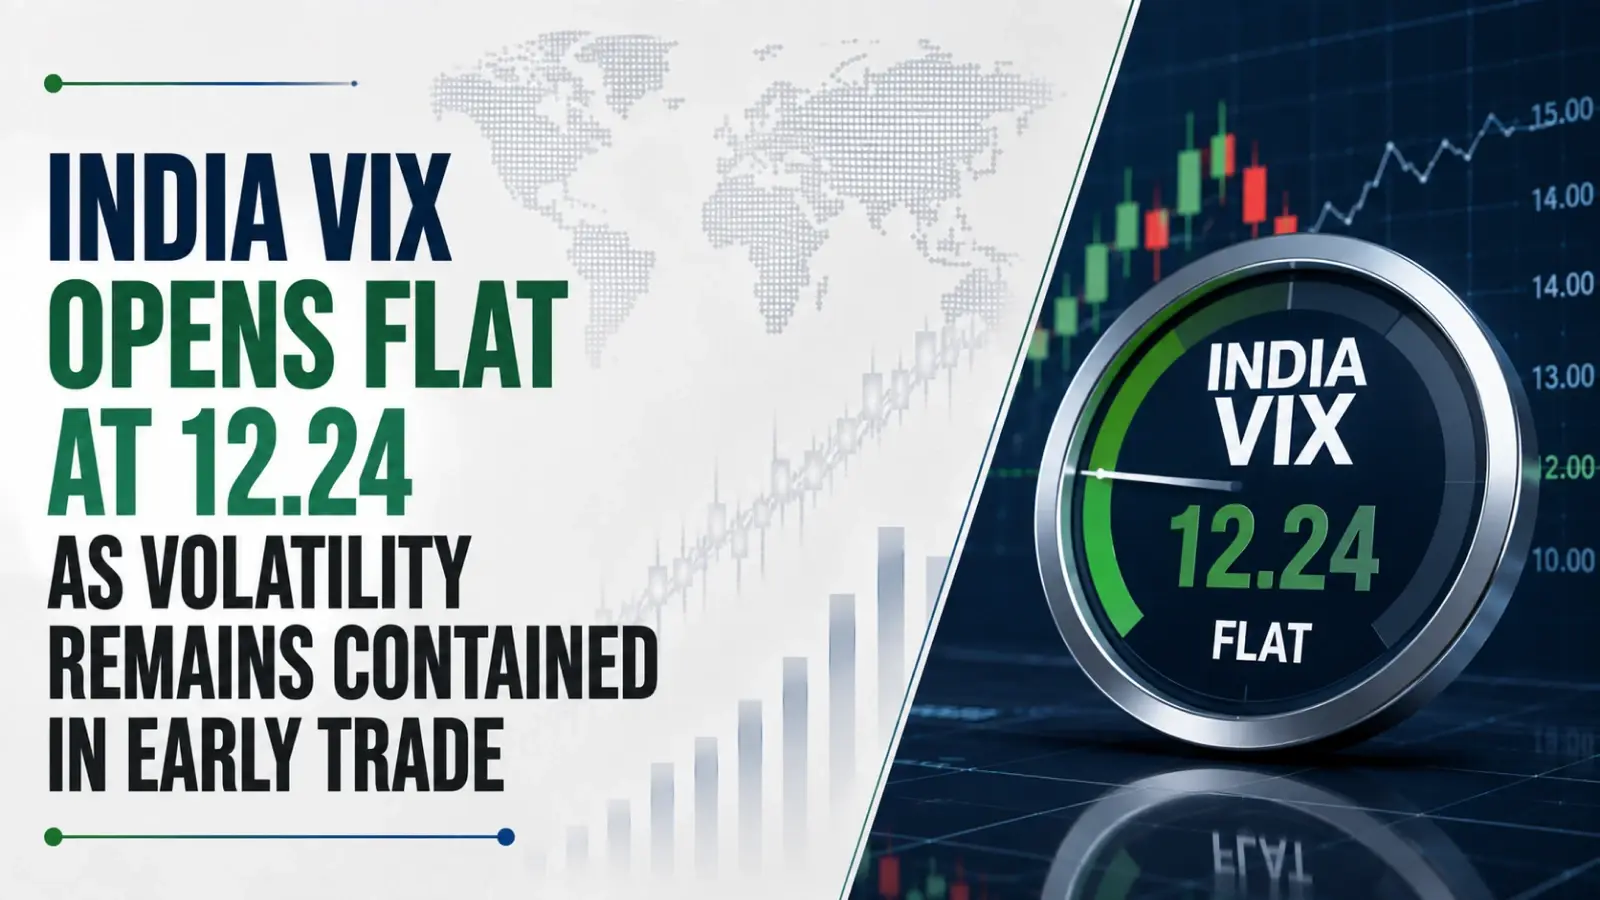
Mumbai, Aug 11: India VIX opened largely unchanged on Tuesday, with the volatility index at 12.24, down 0.05 points or 0.41% from the previous close of 12.25, as of 10:06 IST. The index opened at 12.24 and has moved between an intraday low of 11.19 and a high of 12.45 during the opening session.

India VIX Holds 12.24 As Opening Range Stays Between 11.19 And 12.45
India VIX remained close to the previous session’s level in early trade, indicating limited movement in the opening session. The index’s day range of 11.19–12.45 shows that volatility moved within a relatively narrow band after the market opened.
The previous close stood at 12.25, while the opening value was also 12.24. By 10:06 IST, India VIX was at 12.24, down 0.41%.
The index’s movement comes against a 52-week range of 8.72–28.90, placing the current reading well below its yearly high.
12.24 Reading Keeps India VIX Near August’s 12-Level Range
India VIX has remained around the 12 level in recent sessions, with the latest reading continuing that pattern. The index had a previous close of 12.25, while Tuesday’s opening value was 12.24.
The current movement follows the index’s recent fluctuations within a relatively contained range. The available seasonality data also show that 13 out of 18 years have recorded positive India VIX returns in August.
For August, the historical data show a maximum positive change of 68.84% in 2015, an average positive change of 17.05%, a maximum negative change of 11.26% in 2016, and an average negative change of 6.01%. The average change for the month stands at 10.64%.
High of 12.45 Keeps Volatility Above the Open
Although India VIX opened at 12.24, the index touched a high of 12.45 during the opening session. This represents a movement of 0.21 points from the opening level. The index also fell to a day low of 11.19, creating an opening-session range of 1.26 points between the day’s low and high.
The movement shows that India VIX has fluctuated on both sides of its opening value, even as its latest quoted level remains almost unchanged from the previous close.
Technical Rating Remains Neutral at 12.24
The technical rating for India VIX remains Neutral in the latest available data. The moving averages, technical indicators and moving-average crossovers are currently shown without a rating.
The classic pivot levels for the session are 13.17 for R1, 14.09 for R2, 15.27 for R3, 11.99 for the pivot point, 11.07 for S1, 9.89 for S2 and 8.97 for S3. The Fibonacci levels stand at 12.79, 13.29 and 14.09 on the resistance side, with 11.99 as the pivot and 11.19, 10.69 and 9.89 as the support levels.
Under the Camarilla method, the corresponding levels are 12.44, 12.63 and 12.83 on the upside and 12.06, 11.87 and 11.67 on the downside. These support and resistance levels are calculated using the previous trading day’s price range.
52-Week Range Shows India VIX At 12.24 Remains Far Below 28.90 High
At 12.24, India VIX remains considerably below its 52-week high of 28.90. The index’s 52-week low stands at 8.72.
The current reading therefore sits within the lower portion of its annual range. Tuesday’s opening level is also only marginally below the previous close, indicating that the index has not recorded a significant opening shift.
The data provide a snapshot of the volatility index at the start of Tuesday’s trading session rather than indicating a directional movement in the broader equity market.
August Seasonality Shows 13 of 18 Years with Positive Returns
Historical seasonality data for August show that India VIX has delivered positive returns in 13 out of 18 years.
The strongest positive August change recorded in the available data was 68.84% in 2015, while the average positive change was 17.05%. On the negative side, the maximum decline was 11.26% in 2016, with the average negative change at 6.01%.
The overall average change for August stands at 10.64%, providing historical context for the index’s current movement.
India VIX Opens 0.41% Lower with Volatility Index at 12.24
The opening-session data show India VIX at 12.24, compared with the previous close of 12.25, marking a decline of 0.05 points or 0.41%. The index opened at the same 12.24 level and subsequently traded between 11.19 and 12.45.
The latest movement keeps the volatility index close to the 12 level, while its technical rating remains Neutral. The current session range, 52-week range and August seasonality data provide the key reference points for Tuesday’s opening trade.
India VIX opened at 12.24 on 11 August, down 0.41% from the previous close of 12.25. The index has so far traded between 11.19 and 12.45, while its technical rating remains Neutral. Its 52-week range stands at 8.72–28.90, with August historical data showing positive returns in 13 of 18 years.
Source
- https://www.nseindia.com/reports-indices-historical-vix
Disclaimer
If you have any concerns, questions, or wish to point out any discrepancies in our content, please feel free to write to us at content@hdfcsec.com.
Please Note: The information shared is intended solely for informational purposes and does not make any investment recommendations
Disclaimer
At HDFC SKY*, we take utmost care and due diligence in curating and presenting news and market-related content. However, inadvertent errors or omissions may occasionally occur.
If you have any concerns, questions, or wish to point out any discrepancies in our content, please feel free to write to us at content@hdfcsec.com.
Please Note: The information shared is intended solely for informational purposes and does not make any investment recommendations.
HDFC SKY from HDFC Securities, one of most trusted trading platforms in India, has been recognized with the *Next-Gen Digi Content Awards 2025-26.
 Join Us
 Add as preferred source on Google


More Business News









Open Free Demat Account
Open Free Demat Account












Invest Anytime, Anywhere


By signing up I certify terms, conditions & privacy policy