Nifty 50
- Power Grid Corp₹269.954.10 (1.54%)
- HCL Technologies₹1,209.60-20.20 (-1.64%)
- Tech Mahindra₹1,526.2018.20 (1.21%)
- InterGlobe Aviation₹4,909.50-65.50 (-1.32%)
- ONGC₹236.502.48 (1.06%)
- Hindalco Industries₹1,014.30-12.60 (-1.23%)
- Axis Bank₹1,25011.50 (0.93%)
- Tata Steel₹186.54-2.21 (-1.17%)
- Bharti Airtel₹1,828.9014.20 (0.78%)
- Eicher Motors₹7,658.50-76.00 (-0.98%)
- Bajaj Finance₹1,046.106.80 (0.65%)
- Dr. Reddy's Labs₹1,137-8.00 (-0.70%)
- Shriram Finance₹1,0356.00 (0.58%)
- Sun Pharmaceutical₹1,853.10-11.80 (-0.63%)
- Coal India₹433.352.35 (0.55%)
- Mahindra & Mahindra₹3,130.10-19.90 (-0.63%)
- Cipla₹1,369.906.80 (0.50%)
- Max Healthcare₹1,031-6.50 (-0.63%)
- HDFC Bank₹690.403.30 (0.48%)
- JSW Steel₹1,302-8.00 (-0.61%)

- Offerings
- Tools & Platforms
Tools & Calculators
- Open API
- Calculators
- SIP Calculator
- CAGR Calculator
- Compound Interest Calculator
- FD Calculator
- RD Calculator
- EPF Calculator
- Retirement Calculator
- HDFC SIP Calculator
- Mutual Fund Return Calculator
- Lumpsum Calculator
- Step Up SIP Calculator
- ETF SIP Calculator
- Brokerage Calculator
- Equity Margin Calculator
- SWP Calculator
- EMI Calculator
- MTF Calculator
- Margin Pledge Calculator
- Algo Strategy
- Markets
Stocks
F&O
Mutual Funds
- More
NSE vs BSE: What is the Difference?
Authored By HDFC SKY | Last Modified: Sep 10, 2026 12:03 PM IST
Open Free Demat Account
Open Free Demat Account
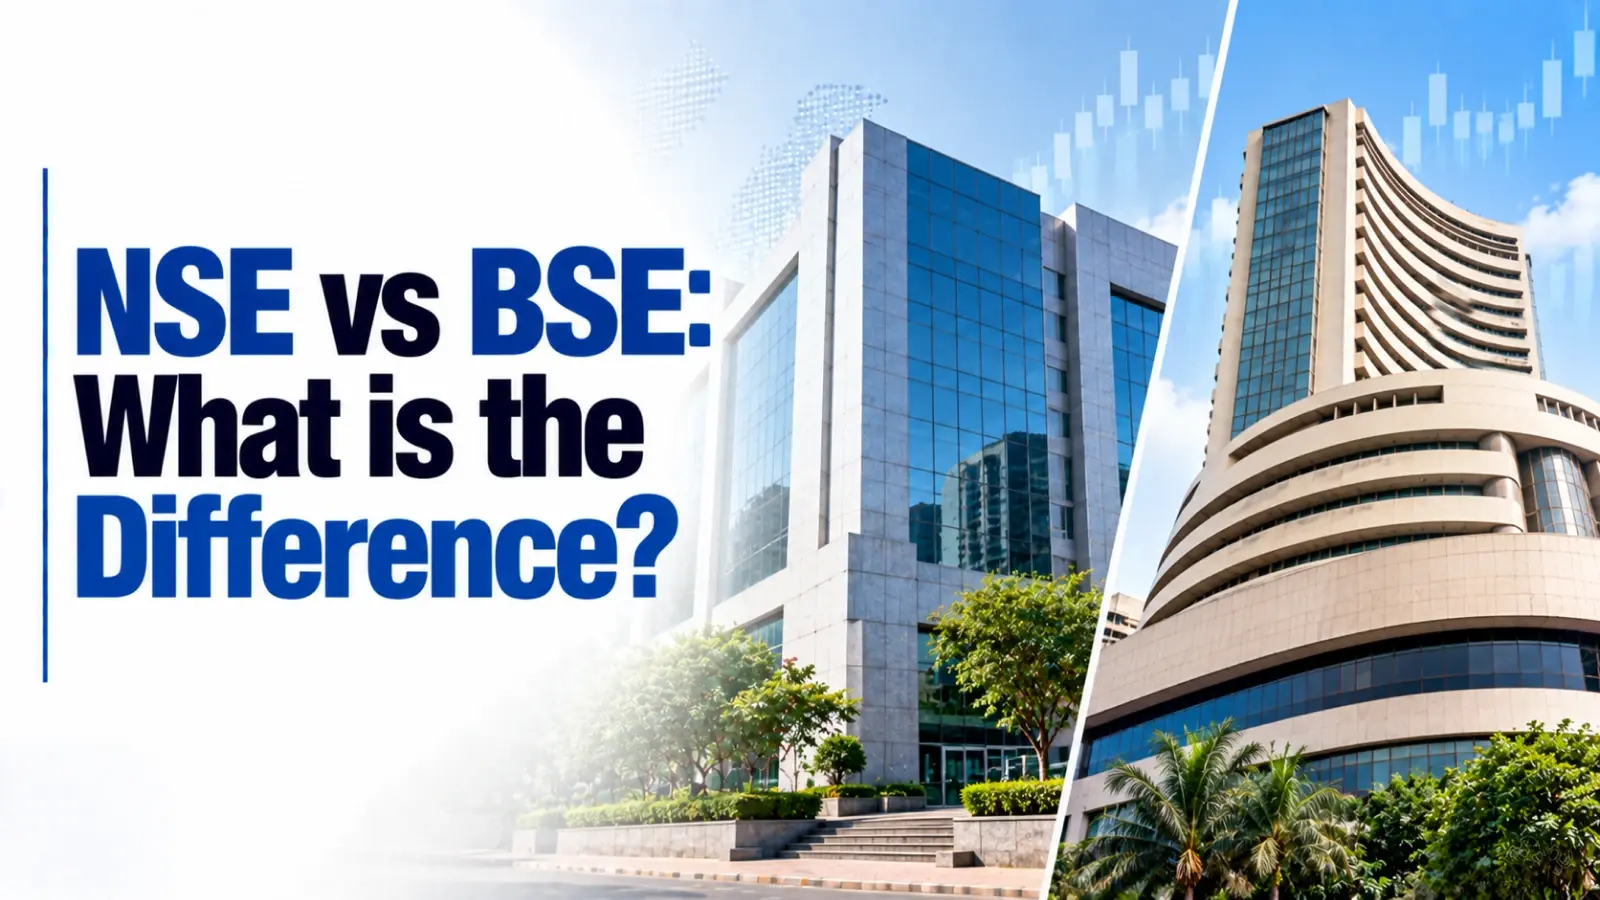
New Delhi, Sept 10: India’s two major stock exchanges, the National Stock Exchange (NSE) and the Bombay Stock Exchange (BSE), sit at the heart of the country’s capital markets, yet they differ meaningfully in history, scale, and how they operate. With the NSE IPO now underway, the comparison has become more relevant than ever. Here’s a breakdown of the key parameters that matter most.

Number of Listed Companies: NSE vs BSE (2012–2026)
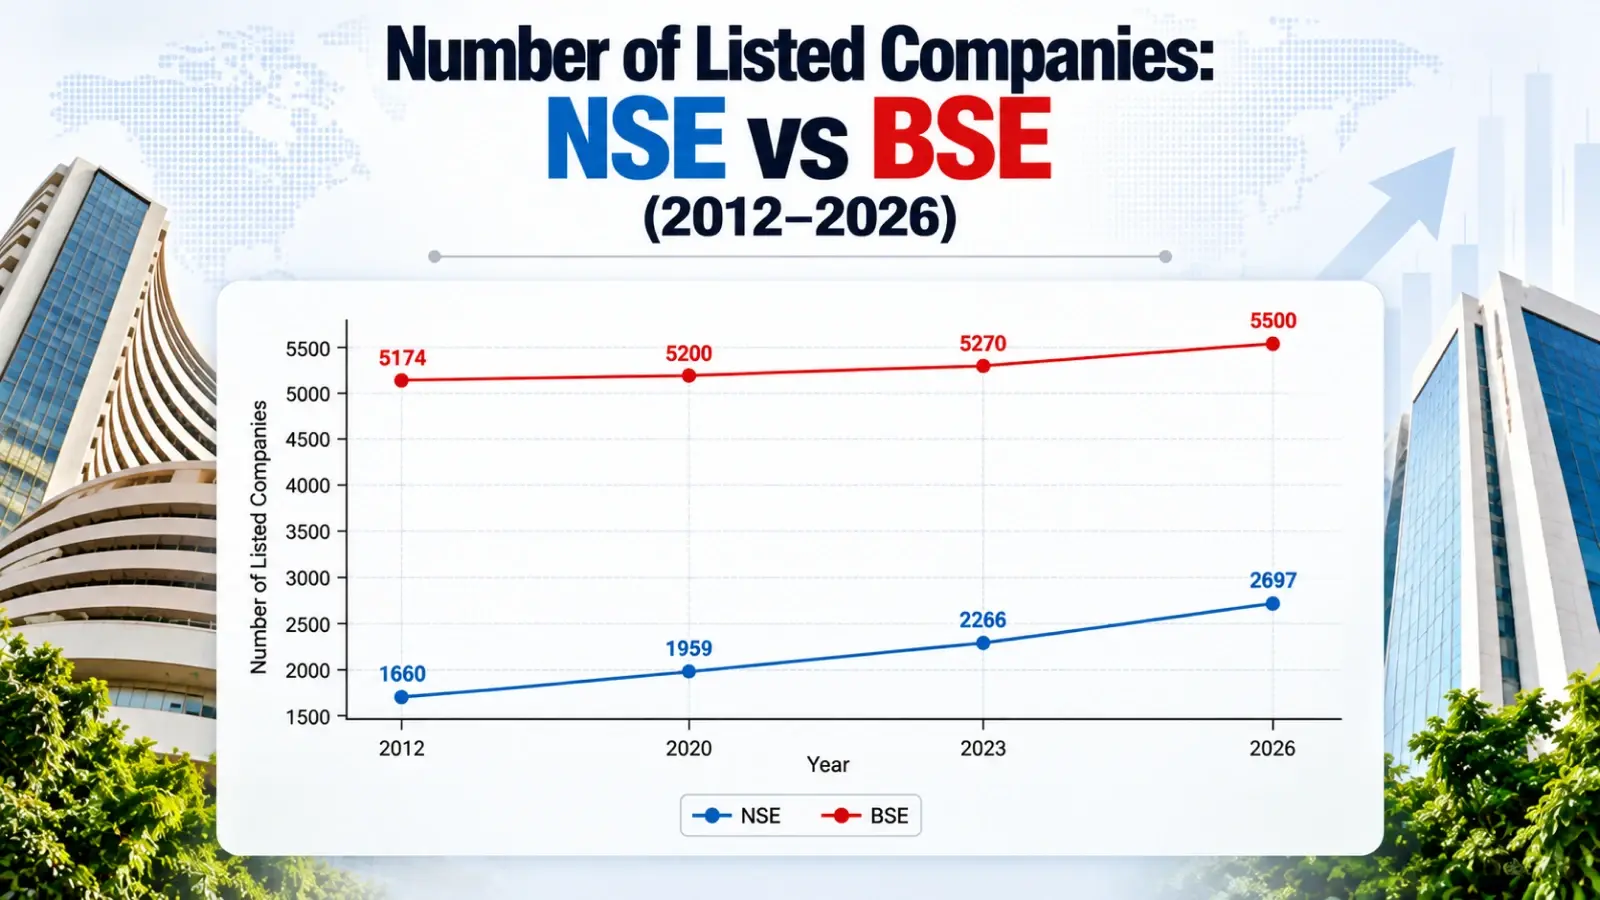
Key takeaway: NSE’s listed-company count has grown roughly 62% since 2012 (1,660 to 2,697), while BSE has grown far more modestly, around 6% in the same span (5,174 to 5,500), despite starting from, and still holding, a much larger base.
Note on data: The 2012 and 2023 figures for both exchanges, and the 2020 and 2026 figures for NSE, are drawn from sourced reports (Business Standard/WFE, Statista, Motilal Oswal, Research360). The BSE 2020 figure (5,200) is an interpolated estimate, since BSE’s listed-company count stayed roughly flat through the 2010s and a precise same-year figure was not available in these sources. For a fully precise, year-by-year series, refer to SEBI’s Handbook of Statistics on the Indian Securities Market.
History and Establishment
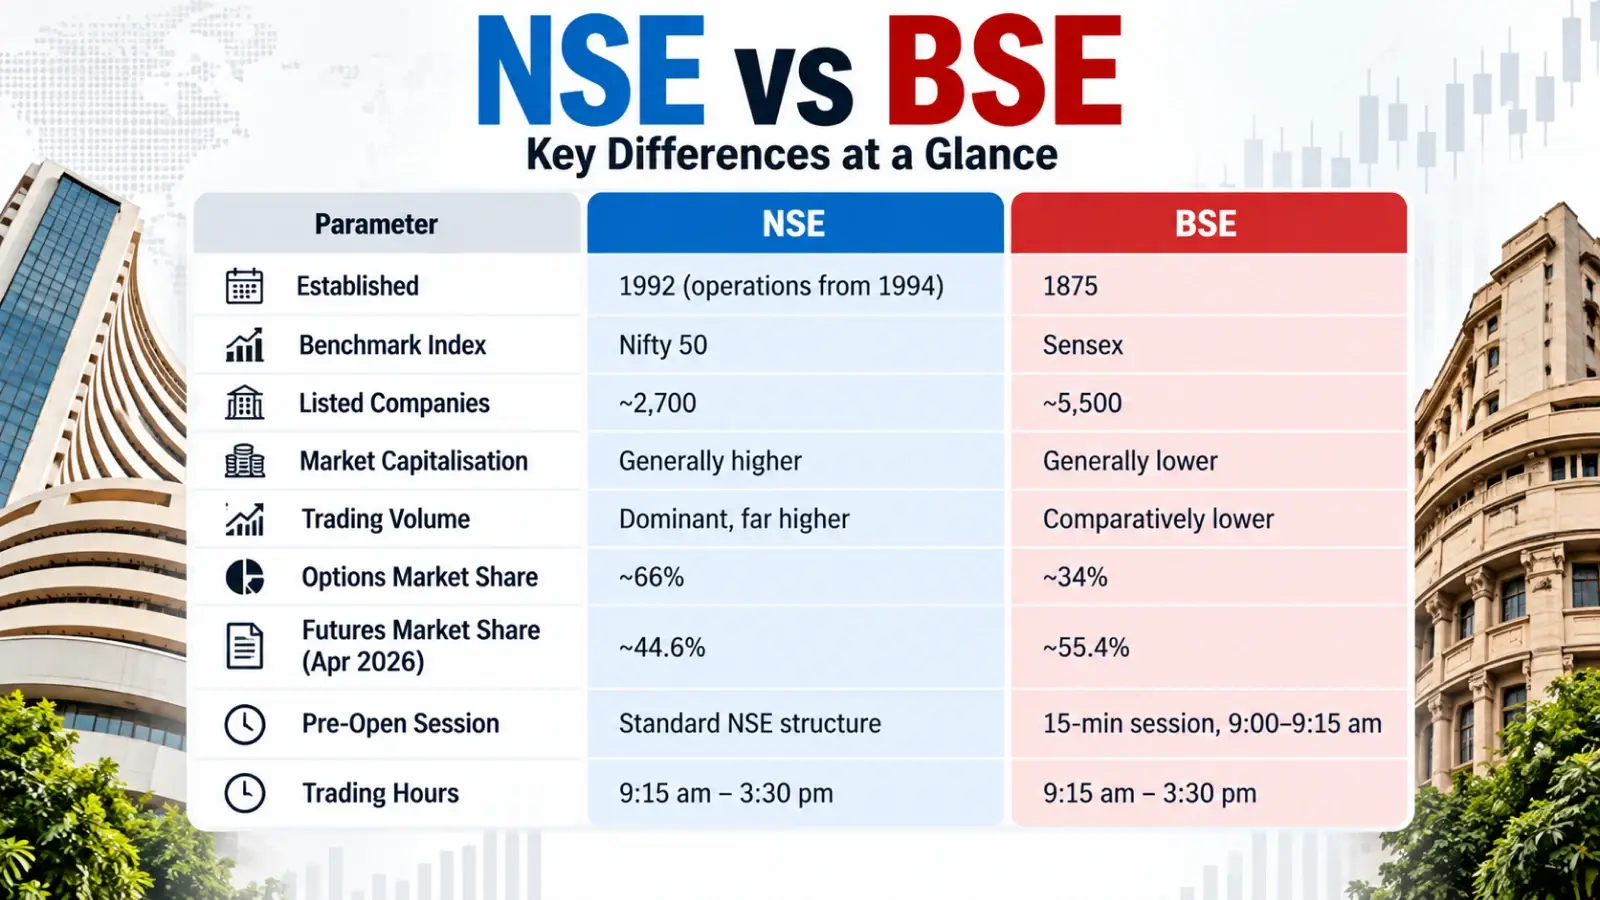
BSE is Asia’s oldest stock exchange, founded in 1875 as the Native Share and Stock Brokers’ Association before formally becoming the Bombay Stock Exchange. NSE, by contrast, was incorporated in 1992 and began operations in 1994, emerging as a technology-first exchange built around electronic, screen-based trading from day one, a structural head start that has shaped much of what separates the two exchanges today.
Benchmark Indices
BSE’s flagship index is the Sensex, tracking 30 major companies, while NSE runs the Nifty 50, covering 50 stocks. Both exchanges also maintain broader index families: BSE offers Sensex 50, Sensex Next 50 and Focused Midcap, while NSE runs Nifty Bank, Nifty 500 and Nifty Midcap 150, among others.
Listed Companies
BSE hosts a far larger universe of listed companies, historically in the 4,000-5,600+ range, including many small and micro-cap names. NSE lists fewer companies, roughly 2,000-2,700, but they tend to be more liquid, established names that see the bulk of daily trading activity.
Market Cap and Trading Volume
NSE typically commands a noticeably higher market capitalisation than BSE, largely because most large-cap, actively traded stocks route the bulk of their volume through NSE even when dual-listed. NSE’s equity cash segment recorded average daily turnover of Rs 1.2 lakh crore in January 2026, a 16-month high, up 27% month-on-month and 24% year-on-year, according to NSE’s own Market Pulse report.
The Derivatives Story Is Shifting
This is where the comparison gets genuinely interesting. NSE has long dominated India’s derivatives market, historically holding over 90% share, and it still commands roughly 66% of the options segment today. But in April 2026, BSE actually overtook NSE in futures & options turnover for the first time, capturing 55.4% market share, credited largely to BSE charging zero transaction fees on futures contracts versus NSE’s 0.00183%, and a lower options fee of 0.005% against NSE’s 0.0355%. It’s a reminder that the gap between the two exchanges isn’t static.
Ownership, Governance and Technology
Both exchanges are regulated by SEBI and operate as demutualized entities, meaning ownership is separated from trading membership, but their shareholder bases and corporate structures differ. This has become especially topical with NSE’s own IPO progressing through 2026, a listing that will make NSE’s ownership structure fully public for the first time. On the global stage, NSE is frequently cited as one of the world’s largest derivatives exchanges by contract volume and ranks among the top-5 exchanges globally by market capitalisation, while BSE, though modernized, generally sits a notch below on these international rankings.
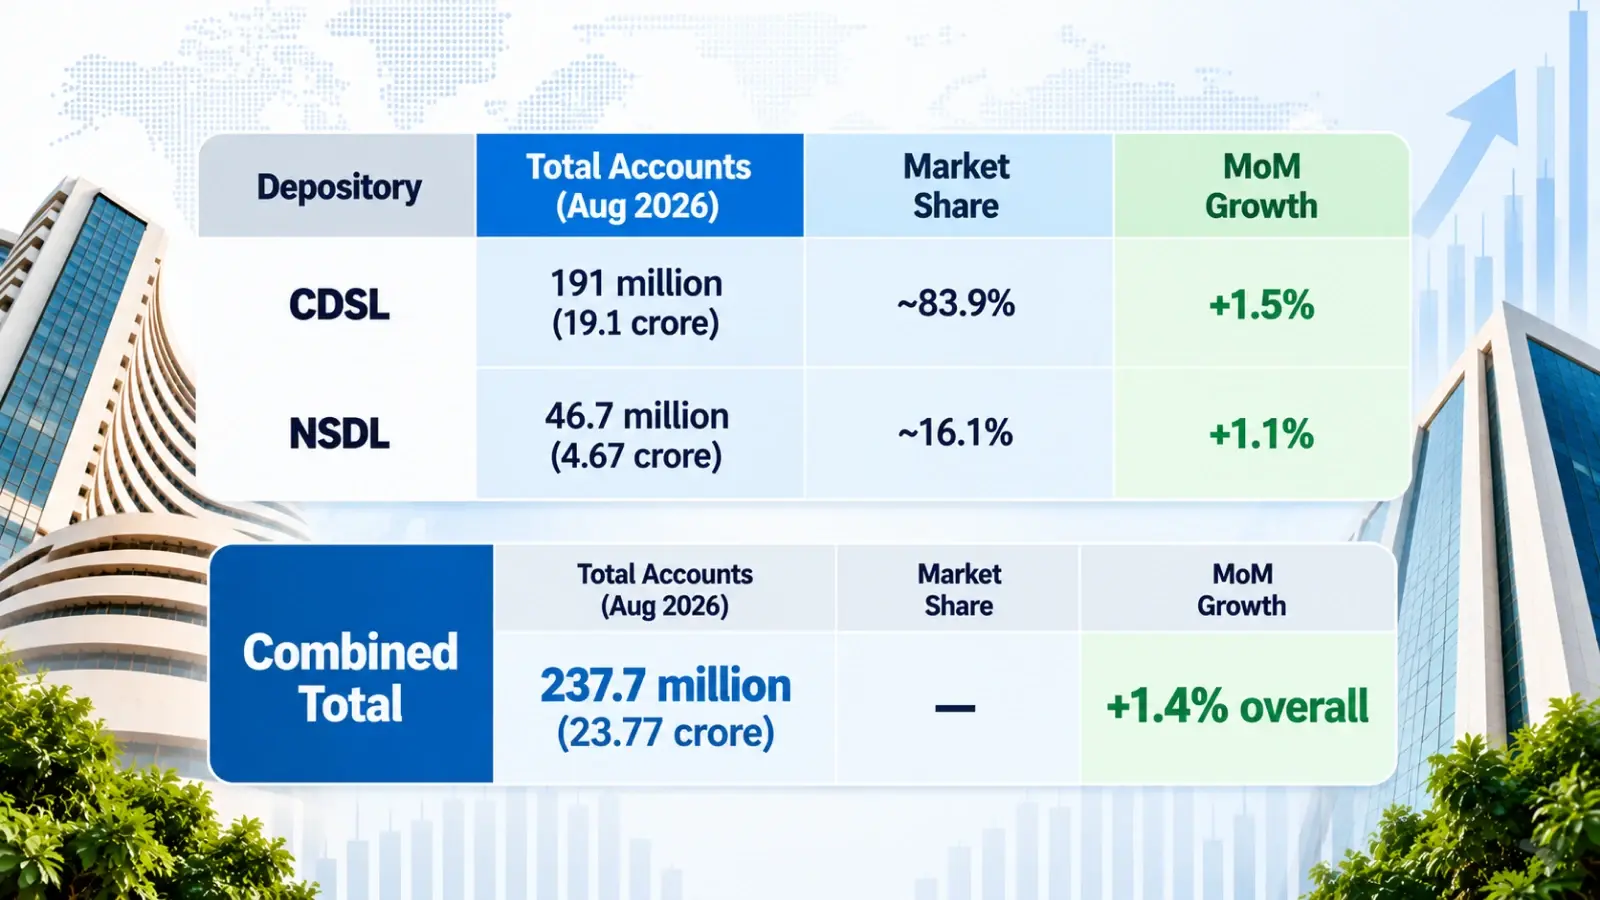
India’s demat account base continues to expand rapidly, fuelled largely by a wave of retail investors entering the market ahead of a busy IPO pipeline. As of August 2026, the total number of demat accounts across both depositories stood at 237.7 million, up 1.4% from the previous month. CDSL remains the dominant player by a wide margin, holding nearly 84% of all accounts, while NSDL trails with a smaller but steadily growing base. The pace of new account additions in August was the fastest since January 2026, reflecting renewed retail enthusiasm for the primary market.
Sources:
- 360 ONE Capital Research, cited in Business Today, “Demat accounts are growing faster than active investors” (September 9, 2026)
- Business Standard, “Demat additions surge to 3.3 mn as IPO boom drives retail investors” (September 8, 2026), citing NSDL, CDSL and SEBI data
Bottom Line
Neither exchange is simply “better.” NSE’s tech-first legacy and institutional depth make it the default venue for large-cap trading and derivatives, while BSE’s sheer breadth of listings and recent aggressive push into F&O pricing show it isn’t conceding ground easily. For investors, the practical difference often comes down to where the specific stock or contract they want sees the most liquidity, information both exchanges’ websites publish in real time.
Disclaimer
At HDFC SKY*, we take utmost care and due diligence in curating and presenting news and market-related content. However, inadvertent errors or omissions may occasionally occur.
If you have any concerns, questions, or wish to point out any discrepancies in our content, please feel free to write to us at content@hdfcsec.com.
Please Note: The information shared is intended solely for informational purposes and does not make any investment recommendations.
HDFC SKY from HDFC Securities, one of most trusted trading platforms in India, has been recognized with the *Next-Gen Digi Content Awards 2025-26.
 Join Us
 Add as preferred source on Google


More Markets News









Open Free Demat Account
Open Free Demat Account










Invest Anytime, Anywhere


By signing up I certify terms, conditions & privacy policy