Nifty 50
- Eternal₹317.4012.95 (4.25%)
- Shriram Finance₹865-35.90 (-3.98%)
- Apollo Hospitals₹7,730125.50 (1.65%)
- Adani Enterprises₹2,477-73.00 (-2.86%)
- ONGC₹227.502.50 (1.11%)
- JSW Steel₹1,185.50-34.50 (-2.83%)
- Asian Paints₹2,30722.20 (0.97%)
- Jio Financial ₹205.03-5.77 (-2.74%)
- TCS₹2,53023.10 (0.92%)
- Tata Steel₹167.67-4.66 (-2.70%)
- UltraTech Cement₹11,05092.00 (0.84%)
- Adani Ports₹1,702.70-47.30 (-2.70%)
- Maruti Suzuki₹11,23060.00 (0.54%)
- Tech Mahindra₹1,790-39.10 (-2.14%)
- Cipla₹1,3387.10 (0.53%)
- Tata Motors PV₹264.60-5.40 (-2.00%)
- Reliance Industries₹1,1905.50 (0.46%)
- Hindalco Industries₹869.85-15.75 (-1.78%)
- Axis Bank₹1,217.505.50 (0.45%)
- Trent₹2,727.50-48.30 (-1.74%)

- Offerings
- Tools & Platforms
Tools & Calculators
- Open API
- Calculators
- SIP Calculator
- CAGR Calculator
- Compound Interest Calculator
- FD Calculator
- RD Calculator
- EPF Calculator
- Retirement Calculator
- HDFC SIP Calculator
- Mutual Fund Return Calculator
- Lumpsum Calculator
- Step Up SIP Calculator
- ETF SIP Calculator
- Brokerage Calculator
- Equity Margin Calculator
- SWP Calculator
- EMI Calculator
- MTF Calculator
- Margin Pledge Calculator
- Algo Strategy
- Markets
Stocks
F&O
Mutual Funds
- More
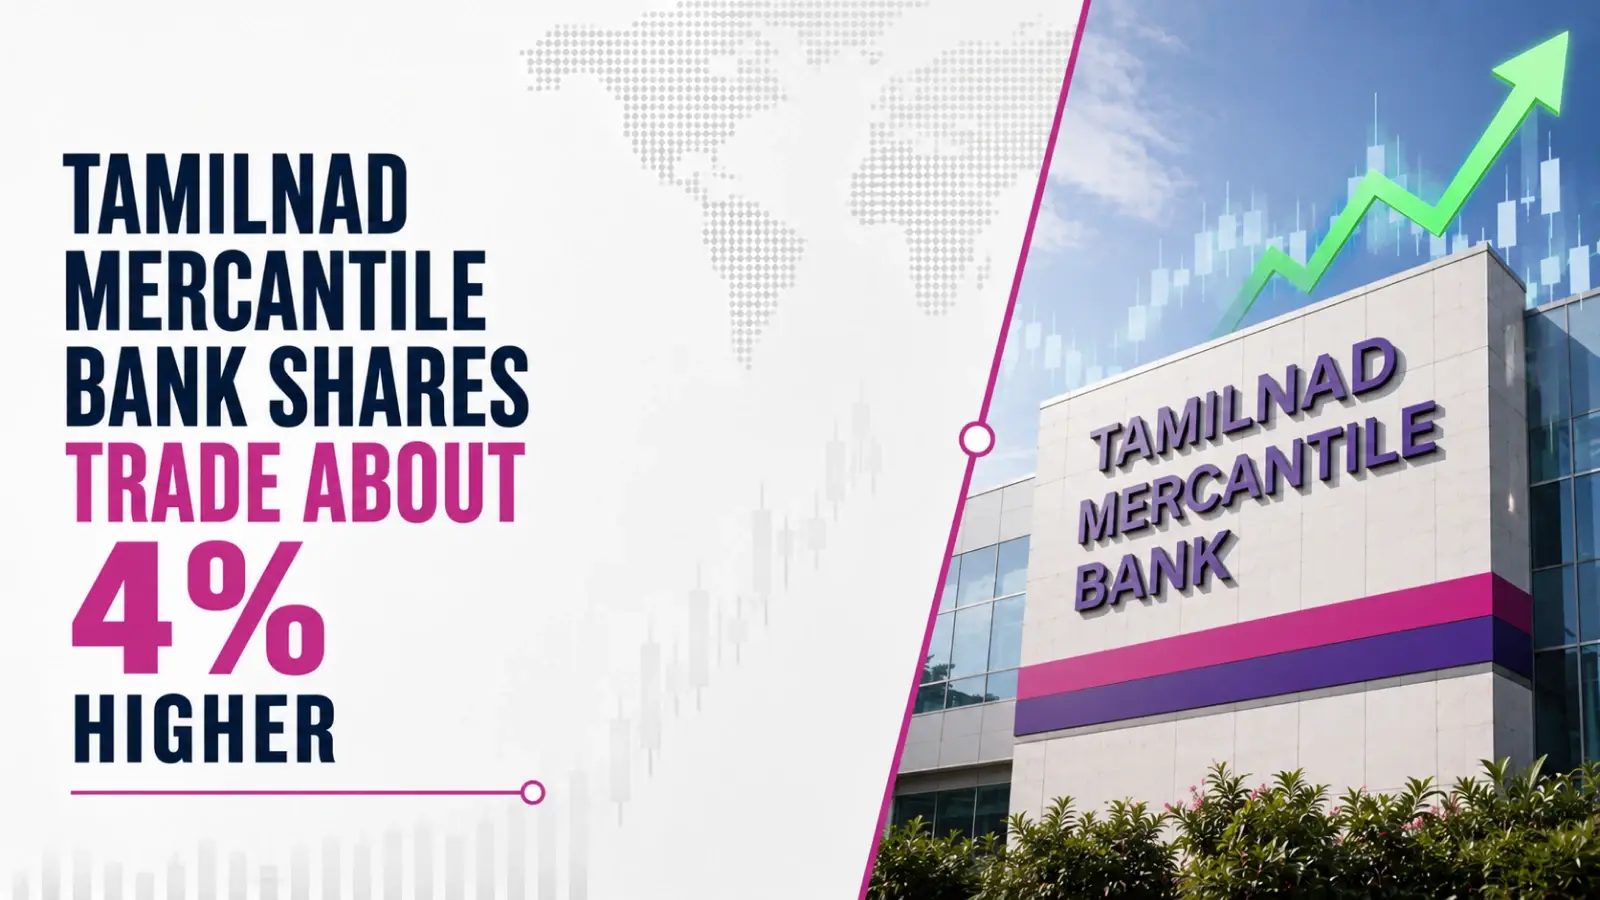
Tamilnad Mercantile Bank Shares Trade About 4% Higher
Authored By HDFC SKY | Last Modified: Jul 15, 2026 02:37 PM IST
Open Free Demat Account
Open Free Demat Account
Mumbai, July 15: Tamilnad Mercantile Bank Ltd shares are trading at ₹808.45, up 4% so far today and in the upper third of their 52-week range, closer to the high than the low, Wednesday.

Key takeaways
- Price: TMB is up 4.40% at ₹808.45 inintraday trade.
- Range: The stock is about 1% below its 52-week high of ₹818.70.
- Activity: About 2.17 lakh shares have traded so far today.
- Valuation: The bank has a marketcapitalisationof about ₹12,907 crore.
A fresh 52-week high defines the intraday picture
The stock opened at ₹798, moved down to an intraday low of ₹792.35 and reached ₹818.70 at its high so far. That gives the session a trading band of about 3.3% between the high and low.
About 2.17 lakh shares have changed hands so far, compared with a full-day average of about 2.47 lakh shares. Since the session remains open, the comparison does not represent a completed day’s activity. The move has come without a fresh company announcement so far today.
The current price is about 96% above the 52-week low of ₹411.80. With the stock trading close to the opposite end of that range, the concrete intraday uncertainty is whether the advance holds through the remainder of the session, as single-session moves can narrow before trading ends.
TMB is outpacing a positive market so far
The broader market is also trading higher, with the NIFTY 50 up 0.54% and the NIFTY 500 advancing 0.63%. Among listed bank peers, KARURVYSYA is up 2.04%, CUB 0.56%, J&KBANK 3.69%, SOUTHBANK 0.71% and KTKBANK 0.71%.
What are TMB’s TTM valuation numbers?
Tamilnad Mercantile Bank has a market capitalisation of about ₹12,907 crore. It trades at a TTM PE of 9.24, with TTM EPS of ₹84.47.
For the rest of today’s session, the observable points are whether TMB continues to trade near its intraday and 52-week high, and how turnover develops against the full-day average as trading progresses.
Frequently asked questions (FAQs)
What is Tamilnad Mercantile Bank’s share price today?
Tamilnad Mercantile Bank was trading at ₹808.45, up 4.40% so far, as of 11:40 AM on July 15, 2026.
Where is TMB trading relative to its 52-week range?
On July 15, 2026, TMB was in the upper third of its 52-week range, closer to the high than the low. It was about 1% below its 52-week high of ₹818.70 and about 96% above its 52-week low of ₹411.80.
What are Tamilnad Mercantile Bank’s market capitalisation and PE?
On July 15, 2026, Tamilnad Mercantile Bank had a market capitalisation of about ₹12,907 crore and traded at a TTM PE of 9.24, with TTM EPS of ₹84.47.
Source
- https://www.nseindia.com/get-quotes/equity?symbol=TMB
Disclaimer
If you have any concerns, questions, or wish to point out any discrepancies in our content, please feel free to write to us at content@hdfcsec.com.
Please Note: The information shared is intended solely for informational purposes and does not make any investment recommendations
Disclaimer
At HDFC SKY*, we take utmost care and due diligence in curating and presenting news and market-related content. However, inadvertent errors or omissions may occasionally occur.
If you have any concerns, questions, or wish to point out any discrepancies in our content, please feel free to write to us at content@hdfcsec.com.
Please Note: The information shared is intended solely for informational purposes and does not make any investment recommendations.
HDFC SKY from HDFC Securities, one of most trusted trading platforms in India, has been recognized with the *Next-Gen Digi Content Awards 2025-26.
 Join Us
 Add as preferred source on Google


More TMB News




Open Free Demat Account
Open Free Demat Account
₹806.50









Invest Anytime, Anywhere


By signing up I certify terms, conditions & privacy policy