Nifty 50
- Bajaj Auto₹10,090312.00 (3.19%)
- Tech Mahindra₹1,462.80-51.30 (-3.39%)
- Tata Steel₹176.272.47 (1.42%)
- Bharti Airtel₹1,767-38.10 (-2.11%)
- Mahindra & Mahindra₹2,835.3039.10 (1.40%)
- ITC₹261.90-4.10 (-1.54%)
- JSW Steel₹1,183.4015.40 (1.32%)
- SBI₹947.65-11.45 (-1.19%)
- Dr. Reddy's Labs₹1,212.3015.30 (1.28%)
- Axis Bank₹1,251.10-8.00 (-0.64%)
- Eicher Motors₹7,138.5088.50 (1.26%)
- Hindustan Unilever₹1,847-9.70 (-0.52%)
- Bharat Electronics₹372.754.60 (1.25%)
- ICICI Bank₹1,348.60-6.40 (-0.47%)
- HDFC Life Insurance ₹563.556.90 (1.24%)
- ONGC₹220.31-0.96 (-0.43%)
- Trent₹2,952.7034.50 (1.18%)
- NTPC₹310.90-1.10 (-0.35%)
- Max Healthcare₹893.709.90 (1.12%)
- L&T₹3,693.30-10.00 (-0.27%)

- Offerings
- Tools & Platforms
Tools & Calculators
- Open API
- Calculators
- SIP Calculator
- CAGR Calculator
- Compound Interest Calculator
- FD Calculator
- RD Calculator
- EPF Calculator
- Retirement Calculator
- HDFC SIP Calculator
- Mutual Fund Return Calculator
- Lumpsum Calculator
- Step Up SIP Calculator
- ETF SIP Calculator
- Brokerage Calculator
- Equity Margin Calculator
- SWP Calculator
- EMI Calculator
- MTF Calculator
- Margin Pledge Calculator
- Algo Strategy
- Markets
Stocks
F&O
Mutual Funds
- More
Weekly US Market Review, August 10-14, 2026: S&P 500 Notches Third Weekly Gain as Cooling Inflation and Tech Rally Offset Oil Jitters
Authored By HDFC SKY | Published at: Aug 15, 2026 10:08 AM IST
Open Free Demat Account
Open Free Demat Account
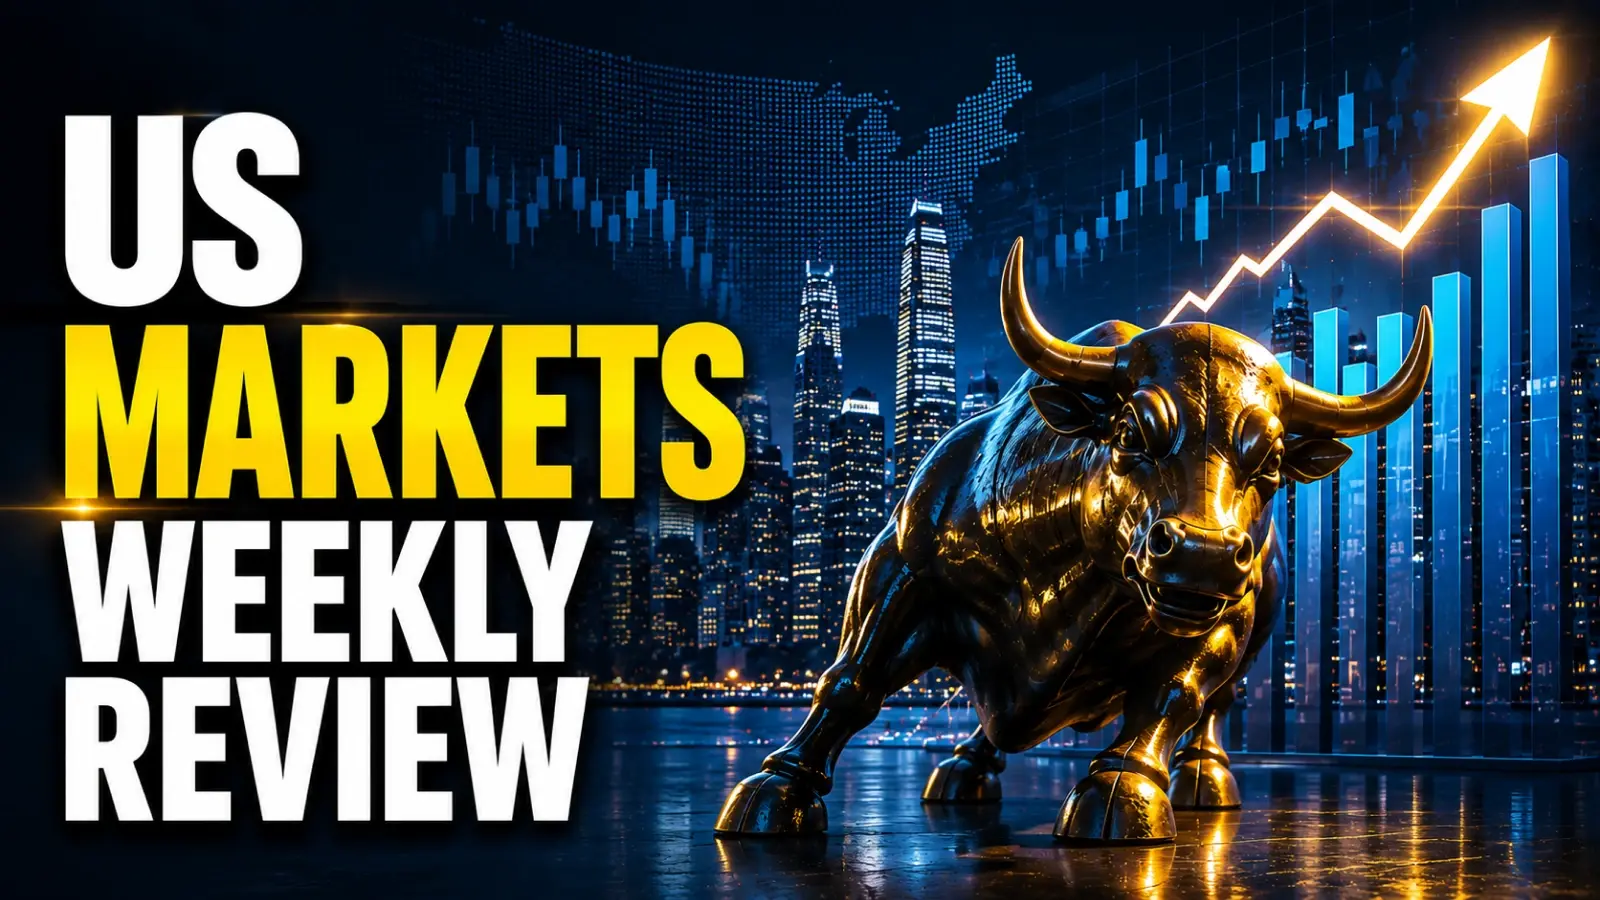
Mumbai, Aug 15: US stock markets concluded the trading week ended August 14 on a mixed note, with the S&P 500 securing its third consecutive weekly gain despite Friday’s modest pullback from record highs. The benchmark index advanced 28.12 points, or 0.4%, for the week to close at 7,785.76. The tech-heavy Nasdaq Composite added 38.55 points, or 0.1%, finishing at 26,729.16. The Dow Jones Industrial Average, however, bucked the trend, declining 304.52 points, or 0.6%, to settle at 53,732.41.
The week’s price action was shaped by a confluence of cooling inflation data, with July Consumer Price Index (CPI) and Producer Price Index (PPI) both coming in softer than expected, persistent geopolitical tensions over the Strait of Hormuz that kept oil prices elevated, and a resurgent artificial intelligence trade that propelled technology and semiconductor stocks higher.
S&P 500 Gains 0.4% for Third Consecutive Weekly Advance as Tech and Energy Lead
The S&P 500 opened the week at 7,754 on Monday, dipping less than 0.1% to roughly 7,753, just a whisker below its record close from the previous Friday. The index slipped 0.3% on Tuesday to 7,728.20 before rebounding 0.26% on Wednesday to 7,748.50 as July CPI data matched expectations.
Thursday saw a more pronounced rally, with the S&P 500 surging 0.65% to 7,798.99, touching a new all-time high. However, Friday brought a pullback, with the index falling 13.23 points, or 0.2%, to 7,785.76 as disappointing retail sales data and renewed oil price swings weighed on sentiment. The weekly gain of 0.4% marked the benchmark’s third consecutive weekly advance. Technology led sector gains for the week, rising 3.4%, followed by a 3.2% advance in energy and a 2.3% increase in communication services. Conversely, utilities declined 3.3% and real estate fell 1.7%.
S&P 500 Weekly Top Gainers and Losers: The index’s weekly gains were led by Super Micro Computer Inc (+33%), SanDisk Corporation (+23%), Marathon Petroleum (+21.8%), Moderna Inc (+16.1%), Phillips 66 (+15.8%). On the losing side, Tapestry Inc (-21%), First Solar (-12%), Broadcom Inc (-7.6%), and Gartner Inc (-6.7%) were among the top weekly losers.
On Tuesday, top gainers included KKR (+6.9%), Axon Enterprise (+6.7%), and Apollo Global Management (+6.3%), while AppLovin and Monster Beverage featured among the losers. On Thursday, Workday (+17.8%), SanDisk (+13.7%), and GoDaddy (+9.5%) led gains, while Tapestry (-16.5%) was the top loser.
Dow Jones Sheds 0.6% as Oil Tensions and Weak Retail Sales Pressure Blue Chips
The Dow Jones Industrial Average underperformed its peers throughout the week, weighed down by its heavier exposure to energy-sensitive industrial and consumer cyclical stocks. The index opened Monday at approximately 53,976, falling about 61 points, or 0.1%. Tuesday saw a steeper decline of 184.13 points, or 0.3%, to 53,791.85. The index remained under pressure on Wednesday, slipping a marginal 21.58 points, or 0.04%, to 53,770.27. Thursday brought a modest recovery, with the Dow gaining 0.13% to 53,839.99.
However, Friday’s 107.58-point, or 0.2%, decline to 53,732.41 sealed the index’s weekly loss of 304.52 points, or 0.6%. The Dow’s weakness was attributed to rising oil prices—Brent crude traded near $87-89 per barrel throughout the week—and disappointing July retail sales data released on Friday, which showed a 0.6% month-on-month decline against expectations of a 0.1% increase.
Dow Jones Weekly Top Gainers and Losers: Chevron Corporation (+7.6%), Merck & Company (+5.7%), Walmart Inc (+4.5%), Salesforce (+2.7%) and JP Morgan Chase & Co (+2.6%) were the top weekly gainers. On the flipside, Home Depot (-3.9%), Travelers Companies (-3.3%), and Honeywell International (-3.0%) were amongst the top losers. On Wednesday, Nvidia (+3.03%), Cisco (+2.86%), and Walmart (+2.43%) led gains, while Microsoft (-2.26%), Salesforce (-2.10%), and Amazon (-1.83%) were the top losers.
Nasdaq Adds 0.1% as AI Resurgence and Semiconductor Rally Offset Profit-Taking.
The Nasdaq Composite exhibited the most volatile performance among the major indices, opening the week at 26,605 on Monday and slipping 0.3% in the first session. Tuesday brought a sharper decline of 159.91 points, or 0.6%, to 26,445.45. However, the tech-heavy index staged a robust recovery on Wednesday, jumping 143.042 points, or 0.54%, to 26,588.488 as AI optimism resurfaced. Thursday saw an even more pronounced rally, with the Nasdaq surging 0.81% to 26,803.03. Friday’s 73.86-point, or 0.3%, decline to 26,729.16 trimmed weekly gains to just 38.55 points, or 0.1%. A resurgent AI trade and performance from semiconductor stocks underpinned the Nasdaq’s resilience. Storage chip makers led the rally, with SanDisk surging nearly 14% on Thursday, while Tesla gained over 3.5% and Meta Platforms rose more than 2.5%.
Also Read: How to invest in US stocks
Nasdaq 100 Weekly Top Gainers and Losers: The Nasdaq 100 extended its winning streak for the third consecutive week, trading over 400 points higher for the week. Nebius Group N.V (+36.2%), SanDisk Corporation (+25.1%), SpaceX (+19.1%), CoreWeave Inc (+19%) ,, and Axon Enterprise (+15%) were the top gainers. On the losing side, Strategy Inc (-8.6%), Cisco Systems (-8.4%), Broadcom Inc (-6.5%), and Cadence Design Systems (-6.06%) were among the top losers. On Tuesday, Axon Enterprise (+6.70%), MercadoLibre (+6.34%), and Nebius (+4.95%) led gains, while Monster Beverage (-50.20%) and AppLovin (-5.99%) were the top losers.
Russell 2000 Outperforms with 1.1% Weekly Gain as Small Caps Lead Rotation
The Russell 2000 index, a gauge of small-cap performance, emerged as the best-performing major index for the week, rising 33.92 points, or 1.1%, to close at 3,068.42. The index’s outperformance reflected a rotation into more cyclical names as investors embraced the broadening of the market rally beyond megacap technology stocks. The Russell 2000 touched a record close of 3,052.85 on Thursday. The Russell 2000’s 23% year-to-date gain leads the S&P 500 by 9.1 percentage points.
S&P 100 Declines 0.57% as Mega-Cap Stocks Face Selective Pressure
The S&P 100 index, comprising the largest US companies, declined 0.57% on 12 August, reflecting selective selling pressure on mega-cap stocks. The index’s performance was dragged down by weakness in several large-cap technology and consumer names, even as the broader market found support from cooling inflation data. The S&P 100’s decline contrasted with the modest gains in the S&P 500, highlighting the divergence between the largest mega-caps and the rest of the market.
Dow Jones Transport and Utility Averages Face Headwinds from Oil and Yields
The Dow Jones Transportation Average, a key indicator of economic activity, came under pressure from rising oil prices, which weighed on airline and freight stocks. The Dow Jones Utility Average faced headwinds from elevated Treasury yields, with the 10-year yield hovering near 4.69% for much of the week, making dividend-paying utility stocks less attractive relative to bonds. The Dow Jones Composite Average reflected the broader market’s mixed performance, with advancers outnumbering decliners on several sessions as the rotation into cyclical names gained traction.
Philadelphia Semiconductor Index Surges on Storage Chip Rally and AI Optimism
The Philadelphia Semiconductor Index (SOX) emerged as a standout performer during the week. The SOX opened the week at 11,993.86 on 10 August, declining 2.94%. However, the index staged a remarkable recovery, rising 0.87% on 11 August to 12,098.47, surging 2.49% on 12 August to 12,399.38, and adding another 0.46% on 13 August to 12,456. On 14 August, the SOX closed at 12,456, unchanged for the day. The semiconductor rally was fueled by renewed AI optimism ahead of Applied Materials’ earnings and sustained investor interest in companies exposed to the artificial intelligence buildout. Memory chip stocks surged as much as 7.8% on 12 August, lifting the SOX 3.3% on AI-driven memory demand. The SOX closed the week just about 1.1% away from bull market territory.
NYSE Composite Reflects Broad-Based Gains as Advancers Outnumber Decliners
The NYSE Composite index reflected the broader market’s mixed performance, with advancers outnumbering decliners on several sessions as the rotation into cyclical names gained traction. The index’s performance was supported by strength in energy, financial, and industrial stocks, while weakness in utilities and real estate limited gains.
S&P MidCap 400 and SmallCap 600 Advance as Broadening Rally Takes Hold
The S&P MidCap 400 index advanced 16.6 points, or 0.43%, on Wednesday to 3,898.99, reflecting continued strength in mid-cap equities. The S&P SmallCap 600 similarly benefited from the rotation into smaller companies, though specific weekly closing figures were not available in the search results. The broadening of the market rally beyond the largest technology names was a recurring theme throughout the week, with investors increasingly rotating into cyclical and value-oriented segments of the market.
VIX Falls to 14.34, Lowest Intraday Since December, as Inflation Fears Ease
The CBOE Volatility Index (VIX), Wall Street’s fear gauge, fell to its lowest intraday level since December, touching 14.34 as tame inflation data and a resilient earnings season trimmed demand for downside protection. The VIX traded down 1.98% at 14.34, extending a slide that pushed implied volatility to multi-month lows.
Also Read: What Are Fractional Shares?
On Wednesday, the VIX logged its lowest close since 9 January at 14.55, down 4.78%. The slide in volatility coincided with a stretch of benign inflation prints, with July’s CPI coming in cooler than expected and Thursday’s wholesale price data reinforcing the view that price pressures are easing. The low-volatility backdrop supported a broad equity rally even as megacap technology names consolidated.
Technology and Energy Lead Sector Gains as Utilities and Real Estate Lag
The 11 S&P 500 sectors exhibited significant divergence during the week. Technology led sector gains, rising 3.4% for the week, followed by a 3.2% advance in energy and a 2.3% increase in communication services. The resurgent AI trade and strength in semiconductor stocks drove the technology sector’s outperformance.
Energy shares benefited from elevated crude oil prices, with Brent holding above $87 per barrel amid the Strait of Hormuz disruption. Financials also performed well, rising 6.0% as of 10 August. On the downside, utilities declined 3.3%, real estate fell 1.7%, and energy (on a different measure) slipped 0.1%. The weakness in utilities and real estate was attributed to elevated Treasury yields, which made dividend-paying stocks less attractive.
Magnificent Seven: Tesla and Meta Surge as Nvidia Builds into Earnings
The Magnificent Seven tech giants exhibited mixed performance during the week. Six of the seven stocks finished higher, with Tesla leading the pack with a gain of nearly 4%. Meta Platforms rose over 2.5%, Apple gained 1%, Microsoft added 0.90%, Google advanced 0.82%, Nvidia rose 0.54%, while Amazon declined 0.80%. Nvidia closed the week near $224, up about 2% on the week and roughly 19% year-to-date, with earnings scheduled for 26 August. Alphabet gave back about 5% during the week. Year-to-date, Amazon leads the group with a 20% increase, followed by Nvidia at +14%, Apple at +13%, Alphabet at +12%, while Microsoft has grown by 4%. Only Amazon and Nvidia among the seven are outperforming the S&P 500’s year-to-date gain of approximately 13%.
Semiconductor, Financial, Energy, and AI Stocks Drive Market Rally
Semiconductor stocks were the standout performers of the week, with memory chip names leading the charge. SanDisk surged 13.7% on Thursday alone, while Western Digital gained 7.3% and SK Hynix rose approximately 9%. The semiconductor rally was catalyzed by strong results from CoreWeave, Super Micro Computer, and Lumentum, with all three companies showing continued strong AI spending. Financial stocks also performed well, with KKR rising 6.9% on Tuesday and Apollo Global Management gaining 6.3%. Energy stocks benefited from elevated crude prices, with Marathon Petroleum rising 5.0% on Tuesday. AI and growth stocks remained in focus, with Workday surging 17.8% on Thursday and GoDaddy gaining 9.5%.
July CPI Cools to 3.4% as Core Inflation Hits 2.5%, Lowest Since March 2021
Inflation readings dominated the week’s economic data releases. July’s Consumer Price Index (CPI) rose 0.1% month-on-month, with the year-on-year rate easing to 3.4%, in line with expectations. Core CPI, which excludes volatile food and energy prices, rose 2.5% year-on-year, down from 3.5% in June and the lowest reading since March 2021. The data reinforced expectations that the Federal Reserve would hold rates steady at its September meeting.
Also Read: US Stock Market Timings
Thursday brought the Producer Price Index (PPI), which showed July PPI unchanged month-on-month, below expectations of a 0.2% increase. The annual rate eased to 4.7% from 5.5%. Core PPI rose 0.2% month-on-month against expectations of 0.3%, with the annual rate at 4.2%. Initial jobless claims for the week ending 8 August rose by 9,000 to 209,000, above expectations of 202,000. Friday’s retail sales report showed a 0.6% month-on-month decline in July, the largest drop in 14 months and significantly below the 0.1% increase expected.
10-Year Treasury Yield Rises to 4.695% as Bond Auction Yields Hit Crisis-Era Highs
The US bond market experienced significant volatility during the week. The 10-year Treasury yield rose 0.038 percentage point to 4.695% for the week, touching an 18-month high. The yield on the 2-year Treasury note fell to 4.193%, while the 30-year yield rose to 5.208%. The yield curve steepened, with the 10-year yield now sitting about 45 basis points above the 2-year, its steepest level since late May.
This week’s auction of new 10-year Treasury bonds yielded the highest issuance rate since the financial crisis at 4.683%, while the 30-year auction drew the highest rate in 25 years. Treasury yields traded higher despite in-line inflation numbers. On Friday, following weak retail sales data, the 10-year yield fell as low as 4.625% before settling near 4.645-4.657%.
Dollar Index Holds Near 100 as Middle East Risk Keeps Greenback Supported
The US dollar index (DXY) held near the 100 mark throughout the week, supported by lingering Middle East risk that kept a defensive bid under the greenback. The index opened the week at 99.81 and weakened slightly on Friday, quoting at 99.63, down 0.24 points from the previous week’s close of 99.87.
Among basket currencies, EUR/USD traded near 1.1528, while GBP/USD remained below 1.3500. The dollar’s resilience, despite cooling inflation data, was attributed to its safe-haven status amid ongoing geopolitical uncertainty over the Strait of Hormuz.
Brent Crude Holds Above $87 as WTI Trades Near $81 on Supply Disruption
Crude oil prices remained elevated throughout the week. Brent crude for October delivery rose 4.99% on 10 August to settle at $87.72, while WTI gained 4.98% to reach $82.16. On Tuesday, Brent rose 1.4% to $88.91 after swinging between $87 and $90. The price action was driven by the protracted US-Iran standoff over the Strait of Hormuz, with ship transits through the critical chokepoint falling dramatically. Gold prices showed mixed performance, with gold rising 0.31% to $4,434.20 per ounce on Friday, while silver and copper also experienced volatility amid shifting risk sentiment. Natural gas prices fluctuated in response to weather forecasts and inventory data.
The week’s market performance was shaped by cooling inflation data, a resurgent AI trade, and persistent geopolitical tensions over the Strait of Hormuz. The S&P 500 secured its third consecutive weekly gain, while the Dow underperformed due to its energy sensitivity. Technology and energy sectors led gains, while utilities and real estate lagged on elevated Treasury yields. The VIX fell to multi-month lows, reflecting reduced demand for downside protection. Key economic data—including CPI, PPI, and retail sales—reinforced expectations that the Federal Reserve will hold rates steady in September. The dollar held near 100 amid Middle East risk, while oil prices remained elevated above $87 per barrel.
Source
Disclaimer
If you have any concerns, questions, or wish to point out any discrepancies in our content, please feel free to write to us at content@hdfcsec.com.
Please Note: The information shared is intended solely for informational purposes and does not make any investment recommendations
Disclaimer
At HDFC SKY*, we take utmost care and due diligence in curating and presenting news and market-related content. However, inadvertent errors or omissions may occasionally occur.
If you have any concerns, questions, or wish to point out any discrepancies in our content, please feel free to write to us at content@hdfcsec.com.
Please Note: The information shared is intended solely for informational purposes and does not make any investment recommendations.
HDFC SKY from HDFC Securities, one of most trusted trading platforms in India, has been recognized with the *Next-Gen Digi Content Awards 2025-26.
 Join Us
 Add as preferred source on Google


More Business News






Open Free Demat Account
Open Free Demat Account









Invest Anytime, Anywhere


By signing up I certify terms, conditions & privacy policy