Nifty 50
- Bajaj Finance₹1,07076.00 (7.65%)
- Apollo Hospitals₹8,371-228.50 (-2.66%)
- Shriram Finance₹96455.25 (6.08%)
- ONGC₹230-5.00 (-2.13%)
- Mahindra & Mahindra₹3,127.50165.60 (5.59%)
- NTPC₹316.70-5.25 (-1.63%)
- Maruti Suzuki₹12,652657.00 (5.48%)
- Coal India₹394.30-5.35 (-1.34%)
- Tata Motors PV₹293.7015.20 (5.46%)
- Adani Ports₹1,884.60-25.40 (-1.33%)
- InterGlobe Aviation₹5,420279.20 (5.43%)
- Bharat Electronics₹395.10-2.90 (-0.73%)
- ICICI Bank₹1,50075.90 (5.33%)
- Dr. Reddy's Labs₹1,366-8.00 (-0.58%)
- BSE₹3,790188.50 (5.23%)
- Bharti Airtel₹2,056.90-10.70 (-0.52%)
- Bajaj Finserv₹1,83578.50 (4.47%)
- ITC₹278.85-1.15 (-0.41%)
- Asian Paints₹2,523.80105.50 (4.36%)
- Power Grid Corp₹261.15-0.90 (-0.34%)

- Offerings
- Tools & Platforms
Tools & Calculators
- Open API
- Calculators
- SIP Calculator
- CAGR Calculator
- Compound Interest Calculator
- FD Calculator
- RD Calculator
- EPF Calculator
- Retirement Calculator
- HDFC SIP Calculator
- Mutual Fund Return Calculator
- Lumpsum Calculator
- Step Up SIP Calculator
- ETF SIP Calculator
- Brokerage Calculator
- Equity Margin Calculator
- SWP Calculator
- EMI Calculator
- MTF Calculator
- Margin Pledge Calculator
- Algo Strategy
- Markets
Stocks
F&O
Mutual Funds
- More
- What Is Historical Candle Data?
- What Does OHLCV Mean?
- Why Historical Candle Data Matters
- Understanding the HDFC SKY Historical Candle Data API
- API Parameters
- How Date Range Works
- Understanding Candle Intervals
- Why Different Intervals Matter
- Historical Limits
- Best Practices for Using Historical Candle Data
- Conclusion
- What Is Historical Candle Data?
- What Does OHLCV Mean?
- Why Historical Candle Data Matters
- Understanding the HDFC SKY Historical Candle Data API
- API Parameters
- How Date Range Works
- Understanding Candle Intervals
- Why Different Intervals Matter
- Historical Limits
- Best Practices for Using Historical Candle Data
- Conclusion
Historical Candle Data-Intervals and Limits in HDFC SKY Open API
By HDFC SKY | Published at: Nov 5, 2026 04:56 PM IST
Open Free Demat Account
Historical market data helps traders and investors understand how a stock, index, or derivative has moved over time. Instead of relying only on live prices, you can study past price action to identify trends, test trading ideas, and improve decision-making.
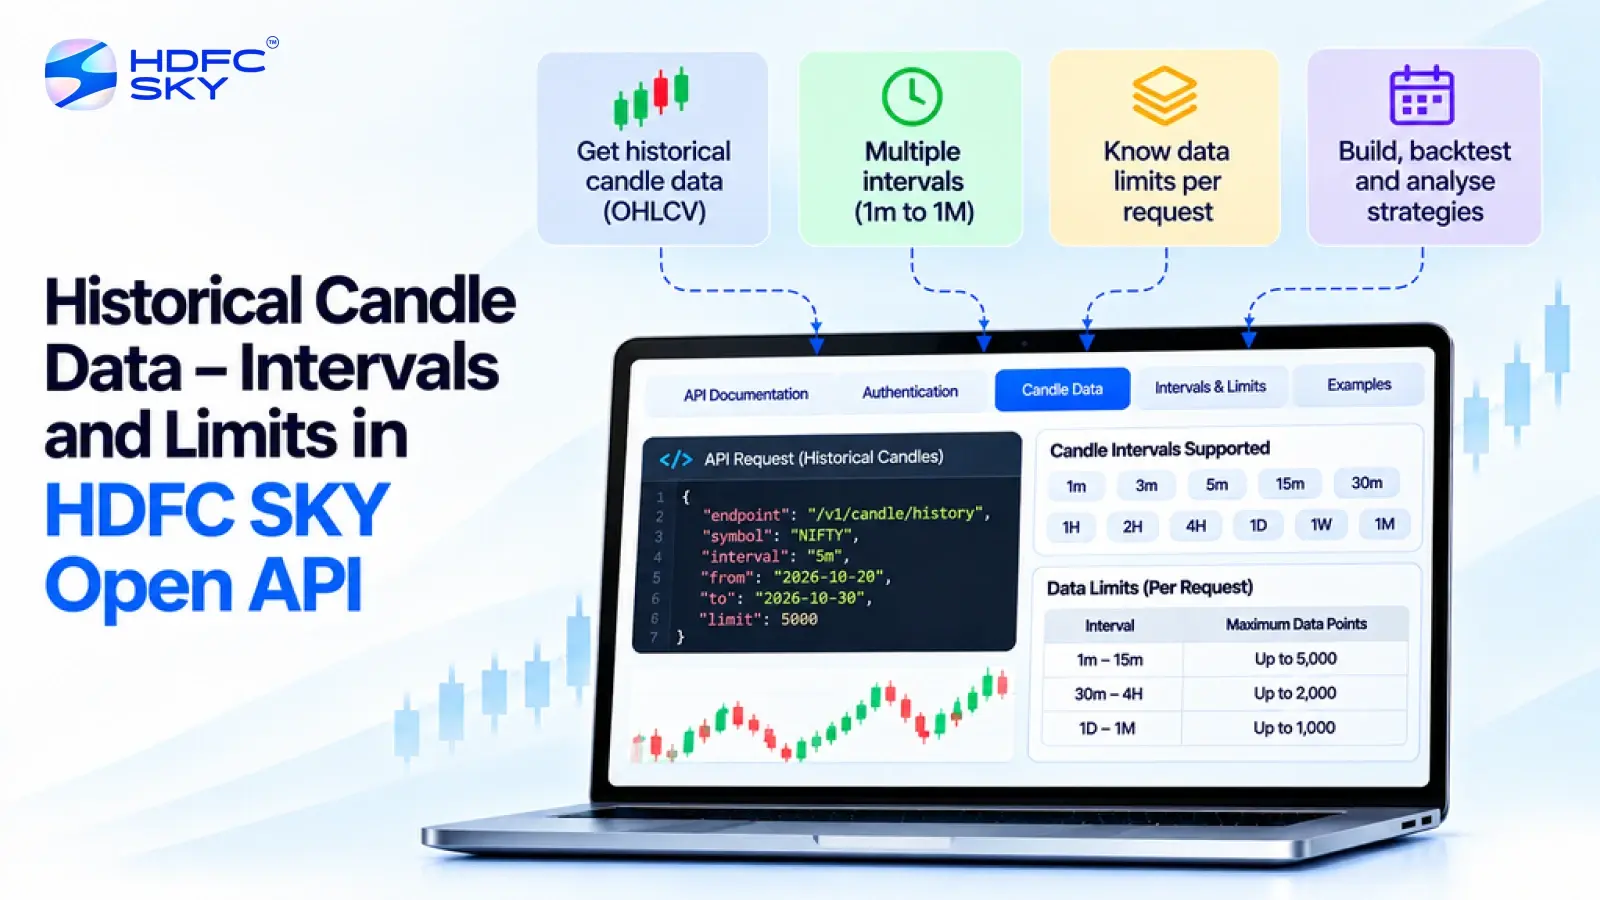
The HDFC SKY Open API offers a Historical Candle Data API that lets developers fetch OHLCV (Open, High, Low, Close, and Volume) data for different time periods. This guide explains how the API works, the available intervals, its key parameters, and the limits you should know before building your application.
What Is Historical Candle Data?
Historical candle data represents the price movement of a security over a specific period. Each candle includes five important values:
- Open price
- High price
- Low price
- Close price
- Volume traded
Together, these values provide a complete picture of market activity during a selected interval. Traders use this data to analyse trends, identify support and resistance levels, and backtest trading strategies.
What Does OHLCV Mean?
The Historical Candle Data API returns OHLCV data for each candle. Understanding these values helps you interpret market movements more effectively.
- Open-The first traded price during the selected time interval.
- High-The highest traded price during the interval.
- Low-The lowest traded price during the interval.
- Close-The last traded price before the interval ends.
- Volume-The total quantity of shares or contracts traded during the interval.
Together, these values provide a clear picture of price movement and trading activity over a specific period.
Why Historical Candle Data Matters
Historical data forms the foundation of technical analysis. It helps users move beyond real-time price tracking and understand how markets behaved in different situations.
Some common uses include:
- Studying historical price trends
- Building technical indicators
- Backtesting trading strategies
- Creating trading dashboards
- Performing quantitative research
- Developing algorithmic trading models
- Comparing price movements across different periods
Without reliable historical data, testing a trading strategy becomes difficult because there is no benchmark for evaluating its performance.
Also Read: How to Modify and Cancel Orders Using the HDFC SKY API
Understanding the HDFC SKY Historical Candle Data API
The HDFC SKY Historical Candle Data API allows applications to retrieve historical OHLCV data using a simple HTTP GET request. Developers can request candle data for different securities by specifying the required query parameters. The API requires a valid API key for authentication before any request can be processed.
- API Endpoint
The endpoint used for fetching historical candle data is:
/oapi/charts-api/charts/v1/fetch-candle
This endpoint returns historical OHLCV candlestick data based on the query parameters supplied in the request. - Authentication
Every request must include a valid api_key.
Authentication ensures that only authorised users can access the API. Before making requests, generate your API credentials from the HDFC SKY Developer Portal. - Supported Chart Types
The HDFC SKY Historical Candle Data API currently supports the following chart types:
- MINUTES-Retrieves intraday candle data
- DAY-Retrieves daily historical candle data
The appropriate chart type depends on your analysis. Intraday traders usually work with minute-based data, while long-term investors often analyse daily candles.
API Parameters
The API uses query parameters to define the data that should be returned.
The important parameters include:
| Parameter | Purpose |
| symbol | Trading symbol of the security |
| exchange | Exchange where the instrument is listed |
| chartType | MINUTES or DAY |
| seriesType | Instrument series |
| start | Beginning of the historical period |
| end | End of the historical period |
| api_key | Authentication key |
Each parameter helps the API identify exactly which historical data to retrieve
How Date Range Works
The start and end parameters define the historical period.
For example, you can request:
- One trading day
- One week
- One month
- Several months
- A longer historical period, subject to API limits
Choosing the correct date range helps reduce unnecessary data transfer and improves application performance.
Understanding Candle Intervals
The interval determines how much market activity each candle represents. For minute-based charts, each candle represents a fixed trading interval. The exact supported minute intervals depend on the configuration available through your HDFC SKY Developer Portal credentials. Smaller intervals generate more detailed datasets, while larger intervals provide a broader market view.
Why Different Intervals Matter
Different trading styles require different intervals.
- Scalpers generally analyse very short intervals.
- Intraday traders often use minute-based charts.
- Swing traders commonly use daily charts.
- Long-term investors focus on daily or longer-term price movements.
Selecting the appropriate interval depends on your trading objective rather than using the smallest interval available.
Historical Limits
Historical APIs usually apply limits to maintain system performance and ensure fair usage across users.
For the HDFC SKY Historical Candle Data API, the supported minute intervals and historical data range depend on the API configuration associated with your developer credentials. Before implementing the API, review the HDFC SKY Developer Portal documentation to understand the historical range and supported intervals available for your account.
Before building an application, verify:
- Supported minute intervals
- Supported historical data range
- Any usage guidelines provided in the developer documentation
Reviewing these details before development helps ensure a smooth integration and prevents unexpected API responses.
Best Practices for Using Historical Candle Data
Following a few simple practices can improve both performance and reliability.
- Request Only the Data You Need
Avoid requesting very large historical periods when only a small dataset is required.
Smaller requests usually return faster. - Use Appropriate Intervals
Choose intervals that match your trading strategy instead of always requesting the finest available granularity. - Cache Frequently Used Data
If your application repeatedly analyses the same historical period, store the results locally instead of making repeated API calls. - Validate User Input
Always check:
I. Symbol
II. Exchange
III. Date format
IV. Start date
V. End date
This reduces invalid API requests. - Handle API Errors Gracefully
Applications should always check for:
I. Authentication failures
II. Invalid symbols
III. Incorrect date ranges
IV. Missing parameters
V. Other API error responses returned by the service
Handling API responses correctly helps your application remain reliable and improves the overall user experience.
Conclusion
The HDFC SKY Historical Candle Data API makes it easier to access structured OHLCV data for market analysis, trading applications, and strategy development. By understanding its parameters, supported chart types, and historical limits, developers can build reliable and efficient solutions. Before deploying your application, always verify the available intervals and historical range supported by your developer credentials through the HDFC SKY Developer Portal to ensure smooth integration and accurate results



Open Free Demat Account
Popular Posts
- 10 Interesting Facts About NSE You Probably Didn’t KnowLast Updated: Sep 30, 2026
- 8-4-3 Rule of SIP - How Does That Work?Last Updated: Jul 30, 2025
- Let's view more exciting Post!
Popular Post from Blogs
- “Bounce Back” Theme Gains Traction in 2026Last Updated: Apr 8, 2026
- 5 Takeaways for Tax Payers from the Budget 2025Last Updated: Jan 29, 2026
- Let’s view more exciting Posts
Invest Anytime, Anywhere


By signing up I certify terms, conditions & privacy policy