Nifty 50
- Bajaj Auto₹10,102324.00 (3.31%)
- Tech Mahindra₹1,465.30-48.80 (-3.22%)
- Dr. Reddy's Labs₹1,223.8026.80 (2.24%)
- Bharti Airtel₹1,768.80-36.30 (-2.01%)
- Bharat Electronics₹374.956.80 (1.85%)
- ITC₹261.15-4.85 (-1.82%)
- Mahindra & Mahindra₹2,835.7039.50 (1.41%)
- SBI₹943.25-15.85 (-1.65%)
- BSE₹3,329.5042.30 (1.29%)
- NTPC₹308.45-3.55 (-1.14%)
- JSW Steel₹1,181.9013.90 (1.19%)
- ICICI Bank₹1,342.70-12.30 (-0.91%)
- Eicher Motors₹7,12878.00 (1.11%)
- Hindustan Unilever₹1,842.10-14.60 (-0.79%)
- Tata Steel₹175.131.33 (0.77%)
- Axis Bank₹1,250.10-9.00 (-0.71%)
- Trent₹2,940.5022.30 (0.76%)
- L&T₹3,682.60-20.70 (-0.56%)
- InterGlobe Aviation₹4,860.6027.60 (0.57%)
- Reliance Industries₹1,164-6.30 (-0.54%)

- Offerings
- Tools & Platforms
Tools & Calculators
- Open API
- Calculators
- SIP Calculator
- CAGR Calculator
- Compound Interest Calculator
- FD Calculator
- RD Calculator
- EPF Calculator
- Retirement Calculator
- HDFC SIP Calculator
- Mutual Fund Return Calculator
- Lumpsum Calculator
- Step Up SIP Calculator
- ETF SIP Calculator
- Brokerage Calculator
- Equity Margin Calculator
- SWP Calculator
- EMI Calculator
- MTF Calculator
- Margin Pledge Calculator
- Algo Strategy
- Markets
Stocks
F&O
Mutual Funds
- More
India VIX At 11.78 Today After Sharp July Spike; Volatility Remains Near Recent Lows
Authored By HDFC SKY | Last Modified: Aug 12, 2026 11:16 AM IST
Open Free Demat Account
Open Free Demat Account
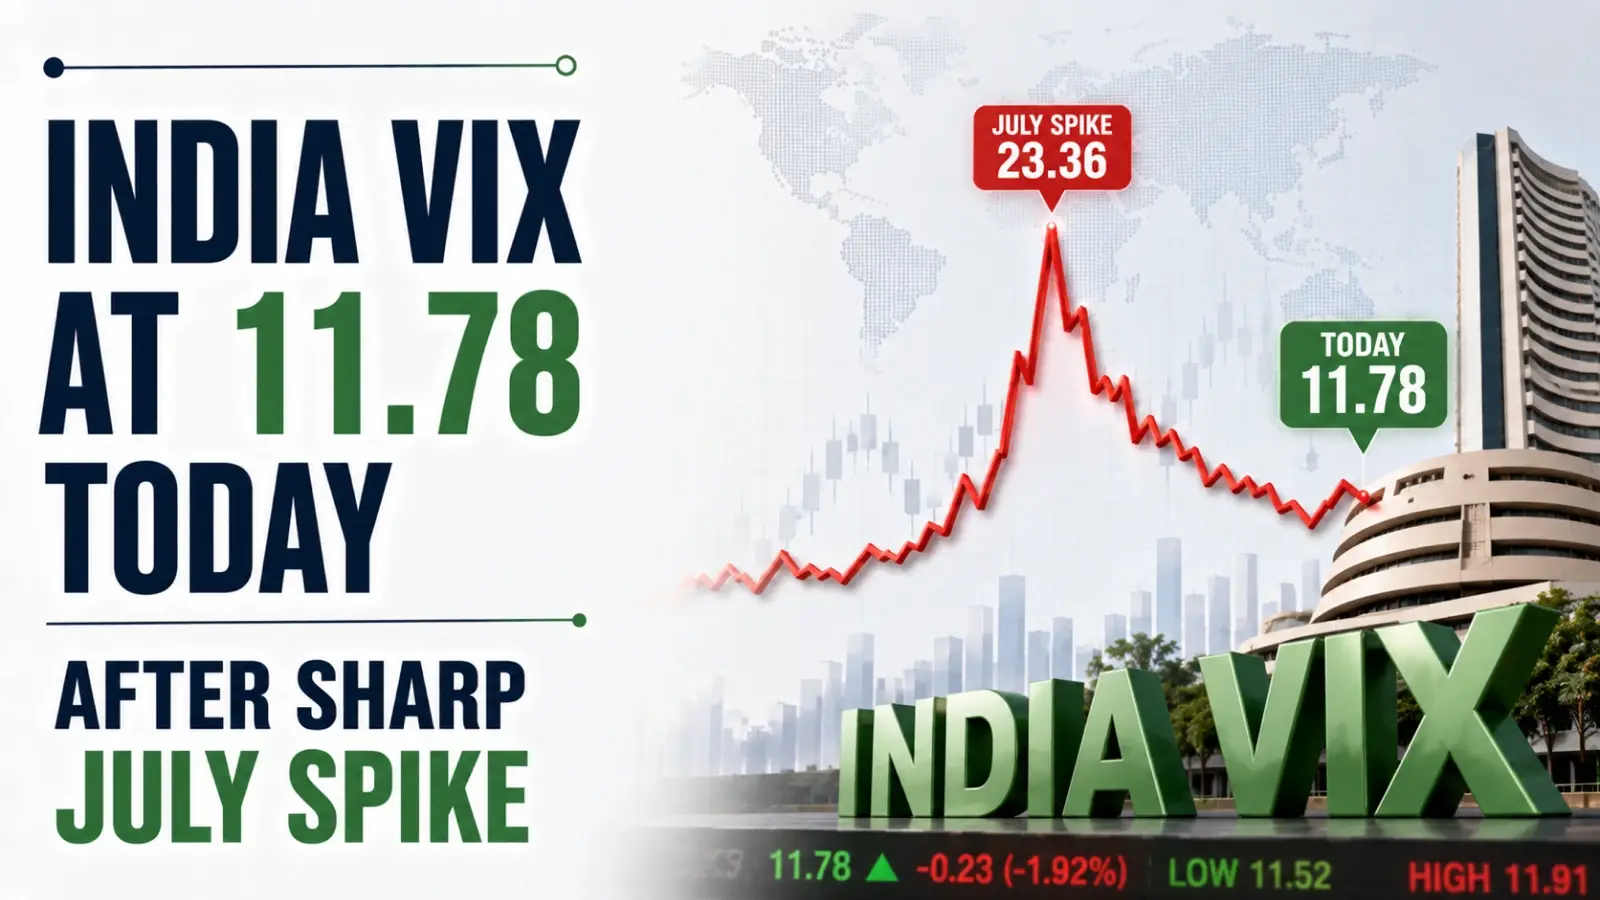
Mumbai, Aug 12: India VIX remained subdued in Wednesday’s opening session, standing at 11.78, down 0.08 point or 0.67% as of 10:15 IST, after opening at 11.85. The volatility gauge moved between 11.25 and 12.03 during the session, keeping it close to the levels seen in the previous session and well below its July spike.

India VIX at 11.78 Keeps Volatility Below July’s 14.68 Spike
The latest reading shows that volatility has remained contained after the sharp increase recorded in July. India VIX had climbed to 14.68 on 8 July, gaining 26.03% in a single session, before gradually moving lower through the rest of July and into August. The index closed at 11.86 on 11 August, down 4% from its previous close of 12.25, after trading between 11.19 and 12.45 during the session.
The decline from July’s peak has been sustained. India VIX moved from 14.68 on 8 July to 13.75 around 14–15 July, 13.15 on 17 July, 13.56 on 20 July, 12.15 on 30 July, 11.75 on 31 July, 11.99 on 3 August, 12.15 on 7 August and 11.86 on 11 August. At the current 11.78 level, the index is around 19.6% below its 8 July reading and approximately 59% below its 52-week high of 28.90.
11.78 Reading Follows a 4% Fall on August 11
The latest opening-session reading follows another notable decline in volatility a day earlier. India VIX opened at 12.24 on 11 August, moved down to an intraday low of 11.19, and ended at 11.86. The 4% one-day decline came after the index had briefly moved higher on 10 August, when it reached 12.69, up 4.36% from 12.16, before subsequently cooling.
The August movement has therefore remained relatively narrow. India VIX closed at 11.99 on 3 August, rose to 12.18 during morning trading on 6 August, ended at 12.15 on 7 August, briefly reached 12.69 on 10 August, and then declined to 11.86 on 11 August. Early data on 12 August places the index around 11.7–11.9, indicating that the temporary rise on 10 August has not translated into a sustained increase.
Crude Oil and West Asia Risks Remain Key Volatility Drivers
Despite the lower VIX level, crude oil and geopolitical developments remain relevant factors in the market’s volatility backdrop. The 11 August market decline was associated with renewed concerns over crude oil prices and uncertainty surrounding the Strait of Hormuz, while approaching F&O expiry also contributed to market volatility. The recent pattern shows that individual risk events can affect equity markets without necessarily producing the broad volatility repricing witnessed in July.
The 8 July episode remains the clearest recent example. India VIX rose from 11.65 to 14.68, while the Nifty 50 fell about 2.1–2.4%, the Sensex declined roughly 1,677 points, and the Nifty Bank fell about 2.5%. At the same time, Brent crude moved above US$78, while geopolitical tensions involving the US and Iran intensified.
RBI Margin Rules and Higher STT Add Structural Pressure
Changes to the derivatives trading environment have also remained part of the India VIX backdrop. The Reserve Bank of India’s new margin and funding rules became effective from 1 July 2026, with reports indicating that derivatives volumes declined by around 20–25% during the first few trading sessions of July. The framework requires banks to obtain 100% collateral for certain funding arrangements involving proprietary trading, including a 50% cash component, reducing leverage available to some proprietary trading activities.
Higher Securities Transaction Tax (STT) on derivatives trades, effective from April 2026, has also increased trading costs. Against this backdrop, India VIX had already cooled from around 17 in early June to approximately 11.5 by early July. Lower volatility, higher transaction costs and tighter collateral requirements have together affected the conditions surrounding derivatives activity.
August Seasonality Shows 13 Positive Years Out of 18
The seasonality data provides another important reference for the current month. India VIX has recorded positive returns in 13 out of 18 years during August. The month’s maximum positive change is 68.84% in 2015, while the average positive change is 16.73%. The maximum negative change is -11.26% in 2016, with an average negative change of -6.01%. The average change for August stands at 10.41%.
The current month has so far remained considerably more contained than the sharp July movement. The index has largely traded within an approximate 11.7–12.7 range during the opening part of August, despite developments involving crude oil, geopolitics, monetary policy and corporate earnings.
RBI Policy and Q1 FY27 Earnings Keep VIX In Focus
The Reserve Bank of India’s policy event in early August did not result in a sustained volatility surge. India VIX ended at 12.15 on 7 August, essentially unchanged, indicating that the policy event was absorbed without a major repricing of near-term Nifty volatility. Meanwhile, the Q1 FY27 earnings season continues to influence volatility levels, with option positioning around earnings announcements contributing to movements in India VIX during July.
India VIX measures expected future volatility rather than simply tracking whether equity indices rise or fall. Consequently, a rising index can coincide with a stronger Nifty when expectations for future price movement increase, while a falling or stable VIX can occur alongside market declines when expected volatility remains contained.
11.78 Remains Above 8.72 But Far Below 28.90
India VIX is currently positioned between its 52-week low of 8.72 and 52-week high of 28.90. The latest reading of 11.78 is approximately 35% above the 52-week low, while remaining substantially below the yearly peak. The index is also below the approximately 17.40 level recorded in early June, representing a decline of around 32% from that level to the 11 August close of 11.86.
For 12 August, the supplied market data shows a neutral technical trend. The Classic pivot levels are R1 at 12.48, R2 at 13.09, R3 at 13.74, PP at 11.83, S1 at 11.22, S2 at 10.57 and S3 at 9.96. These levels are calculated from the previous trading day’s price range.
11.78 Opening Level Keeps August Volatility in a Narrow Range
The latest data indicates that India VIX remains close to the lower end of its recent trading range. The index’s day range of 11.25–12.03, combined with the 11.78 reading at 10:15 IST, places Wednesday’s opening-session movement near the previous session’s levels. The August pattern remains one of contained volatility, following the decline from 14.68 on 8 July and 17.40 in early June.
India VIX stood at 11.78 as of 10:15 IST on 12 August, with a day range of 11.25–12.03. The index remains below July’s 14.68 spike and its 28.90 52-week high, while crude oil, West Asia developments, US inflation data, Q1 FY27 earnings, F&O expiry and regulatory changes remain key factors associated with volatility levels.
Source
- https://www.nseindia.com/reports-indices-historical-vix
Disclaimer
If you have any concerns, questions, or wish to point out any discrepancies in our content, please feel free to write to us at content@hdfcsec.com.
Please Note: The information shared is intended solely for informational purposes and does not make any investment recommendations
Disclaimer
At HDFC SKY*, we take utmost care and due diligence in curating and presenting news and market-related content. However, inadvertent errors or omissions may occasionally occur.
If you have any concerns, questions, or wish to point out any discrepancies in our content, please feel free to write to us at content@hdfcsec.com.
Please Note: The information shared is intended solely for informational purposes and does not make any investment recommendations.
HDFC SKY from HDFC Securities, one of most trusted trading platforms in India, has been recognized with the *Next-Gen Digi Content Awards 2025-26.
 Join Us
 Add as preferred source on Google


More Business News







Open Free Demat Account
Open Free Demat Account











Invest Anytime, Anywhere


By signing up I certify terms, conditions & privacy policy