Nifty 50
- Tech Mahindra₹1,790140.00 (8.48%)
- InterGlobe Aviation₹4,686.90-91.40 (-1.91%)
- TCS₹2,465115.00 (4.89%)
- BSE₹3,363-65.00 (-1.90%)
- Infosys₹1,161.2051.20 (4.61%)
- Max Healthcare₹846-12.00 (-1.40%)
- Bharti Airtel₹1,90551.00 (2.75%)
- Tata Consumer ₹978.90-12.55 (-1.27%)
- Mahindra & Mahindra₹2,920.9059.20 (2.07%)
- Jio Financial ₹216.25-2.76 (-1.26%)
- Bajaj Finance₹98115.75 (1.63%)
- ONGC₹222-2.64 (-1.18%)
- Hindalco Industries₹90814.15 (1.58%)
- Bharat Electronics₹376.85-3.55 (-0.93%)
- HCL Technologies₹1,38020.00 (1.47%)
- Nestle₹1,265.50-10.30 (-0.81%)
- JSW Steel₹1,216.4016.00 (1.33%)
- Adani Enterprises₹2,680.90-19.10 (-0.71%)
- Grasim Industries₹2,92034.10 (1.18%)
- Bajaj Finserv₹1,720-12.00 (-0.69%)

- Offerings
- Tools & Platforms
Tools & Calculators
- Open API
- Calculators
- SIP Calculator
- CAGR Calculator
- Compound Interest Calculator
- FD Calculator
- RD Calculator
- EPF Calculator
- Retirement Calculator
- HDFC SIP Calculator
- Mutual Fund Return Calculator
- Lumpsum Calculator
- Step Up SIP Calculator
- ETF SIP Calculator
- Brokerage Calculator
- Equity Margin Calculator
- SWP Calculator
- EMI Calculator
- MTF Calculator
- Margin Pledge Calculator
- Algo Strategy
- Markets
Stocks
F&O
Mutual Funds
- More
Nasdaq Slips 0.60%, Dow and S&P 500 Fall as US-Iran Impasse Fuels Oil Price Surge Ahead of Key Inflation Data
Authored By HDFC SKY | Published at: Aug 12, 2026 08:51 AM IST
Open Free Demat Account
Open Free Demat Account
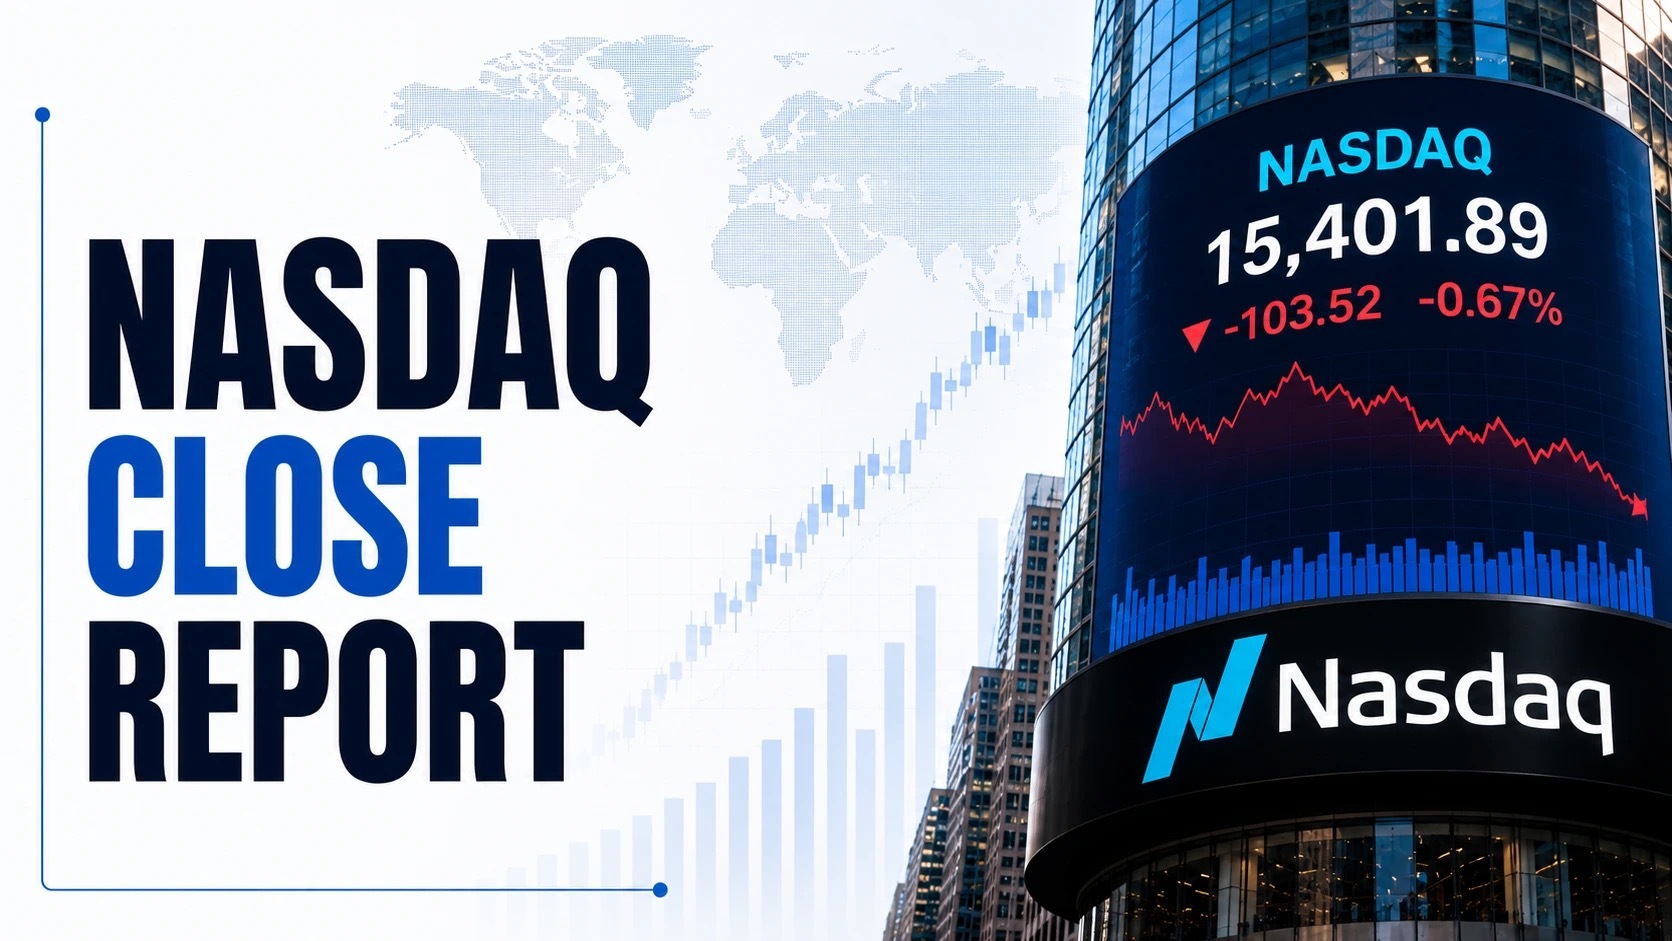
Mumbai, Aug 12: US stock markets closed lower for a second consecutive session on Tuesday, with the technology-heavy Nasdaq Composite leading the decline as geopolitical tensions between the United States and Iran intensified, driving crude oil prices higher and reigniting inflation concerns just a day before the release of July’s Consumer Price Index report.
The Nasdaq Composite (^IXIC) fell 159.91 points, or 0.60%, to settle at 26,445.45, extending its losing streak amid mounting uncertainty over progress toward a deal to reopen the strategic Strait of Hormuz. The Dow Jones Industrial Average (^DJI) shed 184.13 points, or 0.34%, closing at 53,791.85, while the S&P 500 (^GSPC) declined 24.91 points, or 0.32%, to finish at 7,728.20.
The session reflected deepening investor pessimism as hopes for a diplomatic breakthrough between Washington and Tehran faded, with oil prices climbing to their highest levels in nearly two weeks. Market participants now turn their focus to Wednesday’s crucial inflation data, which could shape the Federal Reserve’s monetary policy trajectory amid the dual pressures of rising energy costs and a softening labour market.

Nasdaq Composite Drops 0.60% as Communication Services and Tech Stocks Weigh
The Nasdaq Composite opened at 26,672.17 and traded within a daily range of 26,372.31 to 26,679.26, before closing lower at 26,445.45 on a volume of 6.82 billion shares. The index’s decline was primarily driven by weakness in communication services and technology stocks, with several mega-cap names posting significant losses. Trading volume fell short of the three-month average of 9.70 billion shares, suggesting cautious participation ahead of the inflation report.
The Nasdaq 100, which tracks the largest non-financial companies on the exchange, also ended lower. Notable decliners included Alphabet (GOOGL), which tumbled 3.90%, and its counterpart Google (GOOG), which fell 3.61%, following recent organisational changes in the company’s artificial intelligence divisions that have weighed on investor sentiment.
Dow Jones Industrial Average Sheds 184 Points Despite Energy Sector Resilience
The Dow Jones Industrial Average opened at 53,961.60 and hit an intraday high of 54,222.85 before sliding to a low of 53,746.43 and closing at 53,791.85. Trading volume for the blue-chip index reached 378.37 million shares, below the average of 539.15 million, indicating subdued market participation.
Within the 30-stock index, Honeywell International (HON) was the worst performer, plunging 5.27%, while Amazon (AMZN) fell 2.10%. Apple (AAPL) declined 1.14%, and Microsoft (MSFT) lost 0.49%, adding to the technology-led weakness. On the positive side, Chevron (CVX) gained 0.79% and Caterpillar (CAT) advanced 0.67% as energy and industrial stocks found some support from rising crude prices.
S&P 500 Posts Back-to-Back Losses as Communication Services Sector Sinks
The S&P 500 traded in a range of 7,717.25 to 7,767.51, opening at 7,767.51 and closing lower at 7,728.20 on total volume of 2.49 billion shares. The benchmark index has now dropped 0.32% after hitting a record high last Friday, reflecting heightened caution ahead of the CPI release.
Communication Services emerged as the worst-performing sector, falling more than 2%, dragged down by Alphabet’s near-4% decline and a 5.99% plunge in AppLovin (APP) following a Bank of America downgrade. Information Technology also finished in the red, with Nvidia (NVDA) giving up early gains to close fractionally lower despite announcing partnerships with six asset managers to mobilise over $500 billion for AI infrastructure financing.
Energy was the best-performing sector, climbing 4.63% on the back of rising oil prices. Financials gained modestly on strength in asset managers following Nvidia’s partnership announcement, while Health Care and Materials also outperformed the broader market.
S&P 500 Sector Performance: Energy Surges 4.63% as Tech and Real Estate Lag
Of the 11 sectors tracked by the S&P 500, six ended in positive territory while five closed in the red. The dispersion between the best and worst performers was significant, with sector funds spanning a nearly 6-point range.
Energy (XLE) led all sectors with a gain of 4.63%, benefiting from the sharp rise in crude oil prices amid escalating tensions over the Strait of Hormuz. Oil majors and exploration companies posted broad-based gains as investors priced in sustained supply disruptions. Health Care (XLV) advanced 1.68%, while Materials (XLB) added 0.68%, reflecting defensive positioning and commodity price strength.
Industrials gained approximately 0.7%, helping to offset some of the tech-driven weakness. The sector’s resilience was attributed to expectations of increased infrastructure spending and the cyclical nature of industrial stocks in a still-growing economy.
On the downside, Real Estate (XLRE) was the worst performer, dropping 1.23%, followed by Utilities (XLU) which fell 1.11%. Information Technology (XLK) declined 1.10%, pressured by weakness in mega-cap tech names. Consumer Discretionary also ended lower, weighed down by declines in Amazon and other retail-related stocks.
Russell 2000 Defies Market Downtrend with 0.33% Gain as Small Caps Outperform
The Russell 2000 Index (^RUT) bucked the broader market weakness, rising 9.72 points, or 0.32%, to close at 3,027.12. The small-cap index opened at 3,024.00 and traded within a range of 3,023.47 to 3,036.09, outperforming its larger-cap counterparts.
The resilience of the Russell 2000 reflected the ongoing rotation into smaller, domestically-focused companies, which are perceived as less exposed to global geopolitical risks and currency fluctuations. The index is now positive for the quarter, having gained approximately 0.4% in late-afternoon trading. Notable gainers included Advanced Energy Industries (AEIS), which rose 4.17%, and Archer Aviation (ACHR), which surged 8.62%.
Also Read : US Stock Market Timings
Dow Jones Composite, Transportation and Utility Averages Show Mixed Performance
The Dow Jones Composite Average (DJC) slipped 31.99 points, or 0.19%, to 16,935.01, reflecting broad-based weakness across the index’s components. The index traded between 16,921.59 and 17,040.81 during the session, with the 52-week high recorded at 17,040.81.
The Dow Jones Transportation Average (DJT) fell 68.47 points, or 0.32%, to 21,297.61, underperforming the broader averages as rising fuel costs weighed on transportation and logistics stocks. The index traded in a range of 21,209.15 to 21,466.61, with the 52-week high standing at 24,825.70.
In contrast, the Dow Jones Utility Average (DJU) advanced 11.30 points, or 1.04%, to 1,099.39, benefiting from its defensive characteristics as investors sought shelter from geopolitical uncertainty. The utility index traded between 1,086.21 and 1,101.53, with the 52-week high at 1,202.79.
PHLX Semiconductor Sector Rises 0.92% as Chip Stocks Rebound from Recent Losses
The PHLX Semiconductor Sector Index (SOX) outperformed the broader market, gaining 110.40 points, or 0.92%, to close at 12,104.26. The index traded in a range of 12,006.51 to 12,204.46 on the session.
Semiconductor stocks have been volatile in recent weeks, having entered bear market territory in early June before staging a partial recovery. Tuesday’s gains were led by KLA Corporation (KLAC), which surged 4.04%, and ASML Holding (ASML), which rose 3.80%. Advanced Micro Devices (AMD) gained 1.01%, while Micron Technology (MU) advanced 0.85%.
The sector’s resilience came despite broader market weakness, supported by Nvidia’s AI financing announcement, which boosted sentiment toward chipmakers involved in the artificial intelligence infrastructure buildout.
NYSE Composite and S&P MidCap 400 Edge Higher as Small Caps Show Resilience
The NYSE Composite (NYA) rose 28.60 points, or 0.12%, to 24,696.48, defying the downward trend in the major averages. The index traded between 24,667.88 and 24,782.72, with the 52-week high recorded at 24,782.72.
The S&P MidCap 400 Index (SP400) gained 11.26 points, or 0.29%, to 3,882.81, while the S&P SmallCap 600 Index (SP600) added 4.38 points, or 0.24%, to 1,803.34. Both indices traded within narrow ranges during the session, reflecting the broader rotation into mid and small-cap stocks that has characterised recent market action.
The outperformance of these indices suggests investors are favouring domestic-oriented companies with less international exposure, particularly in light of ongoing geopolitical tensions and currency volatility.
S&P 500 Movers: Datadog Leads Gains as Energy Stocks Rally
Datadog (DDOG) led S&P 500 gainers, surging 11.5% to $260.19, followed by APA (APA), up 9.0% to $40.96, as oil prices climbed. Marathon Petroleum (MPC) gained 7.4% to $319.02, while Akamai (AKAM) and CF Industries (CF) rose 6.4% and 6.2%, respectively. Palo Alto Networks (PANW) added 5.8%, with Diamondback Energy, Phillips 66 and Valero Energy advancing about 5.6%-5.8%.
Coterra Energy (CTRA) was the biggest decliner, plunging 8.6% to $32.56. Verisk Analytics (VRSK) fell 5.4%, while Southwest Airlines (LUV) dropped 4.4%. Trade Desk (TTD) declined 4.4% after a Citigroup downgrade, while Coherent (COHR) fell 14.2% in earlier trading
Also Read: How to Invest in S&P 500 Stocks Through Index Funds
Magnificent Seven Performance: Alphabet Leads Declines as Tech Giants Struggle
The Magnificent Seven mega-cap tech stocks ended mostly lower, with Alphabet (GOOGL) leading the septet lower with a nearly 4% decline. Amazon (AMZN) fell 2.10%, while Apple (AAPL) dropped 1.14% following a downgrade to “underperform” from “hold” at Jefferies. Microsoft (MSFT) lost 0.49%.
Nvidia (NVDA) , which pulled back nearly 3% on Monday, closed fractionally lower after signing memorandums of understanding with six asset managers for up to $500 billion in financing for hyperscaler customers to build out AI data centers and acquire its hardware. Meta Platforms (META) gained 0.71%, while Tesla (TSLA) rose 0.55%, bucking the broader tech weakness.
The Magnificent Seven have gained only about 5.2% year-to-date through August 10, significantly underperforming the S&P 500’s roughly 13% advance over the same period. Amazon leads the group with a 20% gain this year, followed by Nvidia at 14%, Apple at 13%, and Alphabet at 12%, while Microsoft has managed just a 4% gain.
Semiconductor, Financial, Energy and AI Stocks Show Mixed Performance
Semiconductor stocks showed resilience on Tuesday, with the PHLX Semiconductor Index rising 0.92% as chipmakers recovered some of their recent losses. KLA Corporation gained 4.04%, ASML Holding rose 3.80%, and Advanced Micro Devices advanced 1.01%. However, Intel (INTC) remained under pressure, falling approximately 4% after announcing plans to raise $20 billion through a common stock offering, up from the initial $15 billion announced on Monday.
Financial stocks performed well, driven by strength in asset managers following Nvidia’s partnership announcement. Apollo Global Management (APO) rose over 6% , while KKR gained more than 6% and Blackstone advanced 4%. The sector benefited from the prospect of increased financing activity in the AI infrastructure space.
Energy stocks were the clear outperformers, with the sector gaining 4.63% as oil prices surged. Major oil companies including Chevron (CVX) , ExxonMobil (XOM) , and ConocoPhillips (COP) posted solid gains, while refining names like Marathon Petroleum and Valero Energy featured prominently among the top gainers.
AI and growth stocks showed mixed performance. While Datadog surged 11.5% , other AI-related names faced pressure. AppLovin (APP) plunged 5.99% after a Bank of America downgrade, and Super Micro Computer (SMCI) remained volatile ahead of its earnings report scheduled after the closing bell.
Existing Home Sales Fall 1.7% in July as Record Prices and High Mortgage Rates Stifle Buyers
Existing home sales fell 1.7% in July from June to a seasonally adjusted annual rate of 4.06 million units, slightly above the 4.05 million economist forecast, according to the National Association of Realtors. It was the second consecutive monthly decline, as record prices and elevated mortgage rates weighed on buyers. The average 30-year fixed mortgage rate rose 71 basis points since February, reaching 6.69%, its highest since July 2025.
Sales of homes priced at $250,000 or below remained weak, while properties above $1 million performed better. First-time buyers accounted for 29% of sales, down from 33% in June. Inventory fell 1.9% to 1.54 million, while the median price rose 2.0% to $434,100. At July’s sales pace, supply stood at 4.6 months.
Small Business Optimism Hits 11-Month High as Hiring Plans Surge
Small business optimism rose 2.4 points to 99.8 in July, reaching its highest level since August 2025 and surpassing the 52-year average of 98.0, the National Federation of Independent Business reported. Hiring plans drove the improvement, with a seasonally adjusted net 20% of owners planning to create jobs over the next three months, the highest since October 2022 and 9 points above June. NFIB Chief Economist Bill Dunkelberg said businesses expect conditions to improve despite elevated uncertainty.
US Treasury Yields Dip as Geopolitical Risks Keep Fed Policy in Focus
US Treasury yields edged lower Tuesday as geopolitical uncertainty supported safe-haven demand, while investors awaited July inflation data. The 10-year yield fell 1.4 basis points to 4.684%, after touching nearly 4.74%, while the 30-year yield declined 1 basis point to 5.233%, the 5-year yield to 4.40%, and the 2-year yield dropped 1.5 basis points to 4.224%. Attention now turns to Wednesday’s CPI report, with headline inflation expected at 3.4% year-over-year, down from 3.5% in June, and core CPI at 2.5%, versus 2.6%. Traders remain divided on a September Federal Reserve rate move. Chicago Fed President Austan Goolsbee said inflation concerns currently outweigh labour-market weakness, underscoring the Fed’s focus on price stability.
Oil Prices Surge Near One-Week Highs as Supply Risks Mount
Brent crude futures rose 1.4% to $88.91 per barrel, while WTI gained 1.3% to $83.20, with both benchmarks near one-week highs as supply concerns intensified. The US military said it fired missiles to disable a Panama-flagged cargo ship attempting to breach a naval blockade on Iranian ports. Central Command said 55 commercial vessels had been redirected since the operation began, highlighting continued shipping restrictions. Sustained higher oil prices could add to inflation pressures ahead of Wednesday’s CPI report and complicate the Federal Reserve’s efforts to return inflation to its 2% target.
Meanwhile, September US natural gas futures fell 1.0% to $2.767/mmBtu, retreating from Monday’s highest close since July 24. Lower LNG export flows, near-record production and weaker demand forecasts pressured prices. The EIA expects inventories to approach 4 trillion cubic feet in October, the largest pre-winter buffer since 2016.
Gold Edges Higher as Safe-Haven Demand Persists
Gold futures rose 0.8% to $4,453.40 per ounce, while spot gold gained 0.1% to $4,393.69 per ounce , after touching a more than two-month peak earlier at $4,434.84. The precious metal has benefited from geopolitical uncertainty and expectations of easing monetary policy.
Gold has been on a strong run in August, rising approximately 8% month-to-date, driven by the combination of weaker-than-expected payrolls data and hopes for a resolution to the Middle East conflict. However, analysts at Bespoke Investment Group noted that gold has entered overbought territory for the first time since March 10, suggesting a potential pullback in the near term.
Also Read: How to Invest in the US Stocks From India
Dollar Index Steady Near 99.80 as Currency Markets Await CPI
The US Dollar Index (DXY) traded near flat at 99.81 , reflecting market caution ahead of the inflation data and ongoing geopolitical uncertainty. The greenback has been range-bound in recent sessions as investors weigh competing forces of safe-haven demand and expectations for Federal Reserve policy.
The EUR/USD pair traded at 1.154 , while the USD/JPY pair was steady at 159.25 , as markets awaited Wednesday’s CPI data for direction. Rabobank strategists noted that a softer-than-expected inflation print could ease pressure on the Japanese yen, potentially reducing the likelihood of further intervention by Japanese authorities.
Volatility Index Rises as Market Uncertainty Grows
The CBOE Volatility Index (VIX) rose 0.56 point, or 3.76%, to 15.46, reflecting increased market uncertainty amid geopolitical tensions and the approaching inflation data. While still below the long-term average, the VIX has risen from recent lows as investors price in the potential for market-moving news.
The VIX’s modest increase suggests that while investors are cautious, there is no panic in the market. The index has remained relatively subdued compared to previous geopolitical crises, indicating that markets are broadly pricing in a resolution to the Middle East conflict.
US-Iran tensions, elevated oil prices and Wednesday’s CPI report are shaping equity markets. Treasury yields remain crucial for technology valuations, while inflation data could influence Federal Reserve expectations. Ongoing Middle East uncertainty is likely to keep oil prices volatile.
Source
- https://www.nasdaq.com/
- spglobal.com/spdji/en/indices/equity/sp-500/
- https://www.dowjones.com/
- https://www.spglobal.com/spdji/en/indices/equity/dow-jones-industrial-average/
- https://www.spglobal.com/spdji/en/indices/equity/sp-500/
- https://www.nasdaq.com/market-activity/index/comp
- https://www.nasdaq.com/market-activity/quotes/nasdaq-ndx-index
- https://www.spglobal.com/spdji/en/indices/equity/sp-100/
- https://www.lseg.com/en/ftse-russell/indices/russell-us
- https://www.nyse.com/index
- https://www.nyse.com/index
- https://www.spglobal.com/spdji/en/indices/equity/dow-jones-transportation-average/
- https://www.spglobal.com/spdji/en/indices/equity/dow-jones-utility-average/
- https://www.spglobal.com/spdji/en/indices/equity/dow-jones-composite-average/
- https://www.nasdaq.com/market-activity/index/sox
- https://www.cboe.com/tradable_products/vix/
Disclaimer
At HDFC SKY*, we take utmost care and due diligence in curating and presenting news and market-related content. However, inadvertent errors or omissions may occasionally occur.
If you have any concerns, questions, or wish to point out any discrepancies in our content, please feel free to write to us at content@hdfcsec.com.
Please Note: The information shared is intended solely for informational purposes and does not make any investment recommendations.
HDFC SKY from HDFC Securities, one of most trusted trading platforms in India, has been recognized with the *Next-Gen Digi Content Awards 2025-26.
 Join Us
 Add as preferred source on Google


More International News








Open Free Demat Account
Open Free Demat Account











Invest Anytime, Anywhere


By signing up I certify terms, conditions & privacy policy