Nifty 50
- Tech Mahindra₹1,790140.00 (8.48%)
- InterGlobe Aviation₹4,686.90-91.40 (-1.91%)
- TCS₹2,465115.00 (4.89%)
- BSE₹3,363-65.00 (-1.90%)
- Infosys₹1,161.2051.20 (4.61%)
- Max Healthcare₹846-12.00 (-1.40%)
- Bharti Airtel₹1,90551.00 (2.75%)
- Tata Consumer ₹978.90-12.55 (-1.27%)
- Mahindra & Mahindra₹2,920.9059.20 (2.07%)
- Jio Financial ₹216.25-2.76 (-1.26%)
- Bajaj Finance₹98115.75 (1.63%)
- ONGC₹222-2.64 (-1.18%)
- Hindalco Industries₹90814.15 (1.58%)
- Bharat Electronics₹376.85-3.55 (-0.93%)
- HCL Technologies₹1,38020.00 (1.47%)
- Nestle₹1,265.50-10.30 (-0.81%)
- JSW Steel₹1,216.4016.00 (1.33%)
- Adani Enterprises₹2,680.90-19.10 (-0.71%)
- Grasim Industries₹2,92034.10 (1.18%)
- Bajaj Finserv₹1,720-12.00 (-0.69%)

- Offerings
- Tools & Platforms
Tools & Calculators
- Open API
- Calculators
- SIP Calculator
- CAGR Calculator
- Compound Interest Calculator
- FD Calculator
- RD Calculator
- EPF Calculator
- Retirement Calculator
- HDFC SIP Calculator
- Mutual Fund Return Calculator
- Lumpsum Calculator
- Step Up SIP Calculator
- ETF SIP Calculator
- Brokerage Calculator
- Equity Margin Calculator
- SWP Calculator
- EMI Calculator
- MTF Calculator
- Margin Pledge Calculator
- Algo Strategy
- Markets
Stocks
F&O
Mutual Funds
- More
S&P 500 Hits Record 7,798, Nasdaq Jumps 0.81% as Cooling PPI Data Eases Fed Rate-Hike Fears
Authored By HDFC SKY | Last Modified: Aug 14, 2026 08:45 AM IST
Open Free Demat Account
Open Free Demat Account
Mumbai, Aug 14: U.S. equity markets advanced across the board on Thursday, with the S&P 500 notching a fresh record closing high, as softer-than-expected wholesale inflation data reinforced expectations that the Federal Reserve will hold interest rates steady at its September meeting. The technology-heavy Nasdaq Composite outperformed, climbing nearly 1%, while the Dow Jones Industrial Average eked out a modest gain, snapping a three-session losing streak. Declining crude oil prices, which fell more than 2%, further bolstered risk appetite, alleviating concerns over energy-driven inflationary pressures.

S&P 500 Surges 0.65% to Record 7,798.99, Breaches 7,800 Intraday
The broad-market S&P 500 gained 50.49 points, or 0.65%, to close at a record 7,798.99, surpassing the 7,800 threshold for the first time in intraday trading at 7,816.70. The index opened at 7,763.18 and touched an intraday low of 7,763.18. Trading volume on the S&P 500 stood at 2.64 billion shares. The benchmark’s advance was propelled by strength across information technology and real estate sectors, with eight of the 11 primary sectors finishing in positive territory.
Among the index’s notable performers, Dell Technologies surged approximately 9.87%, while Coterra Energy declined 8.62%. The record close marks the S&P 500’s 47th all-time high of the year, underscoring the sustained bullish momentum despite concerns over geopolitical tensions and inflationary pressures.
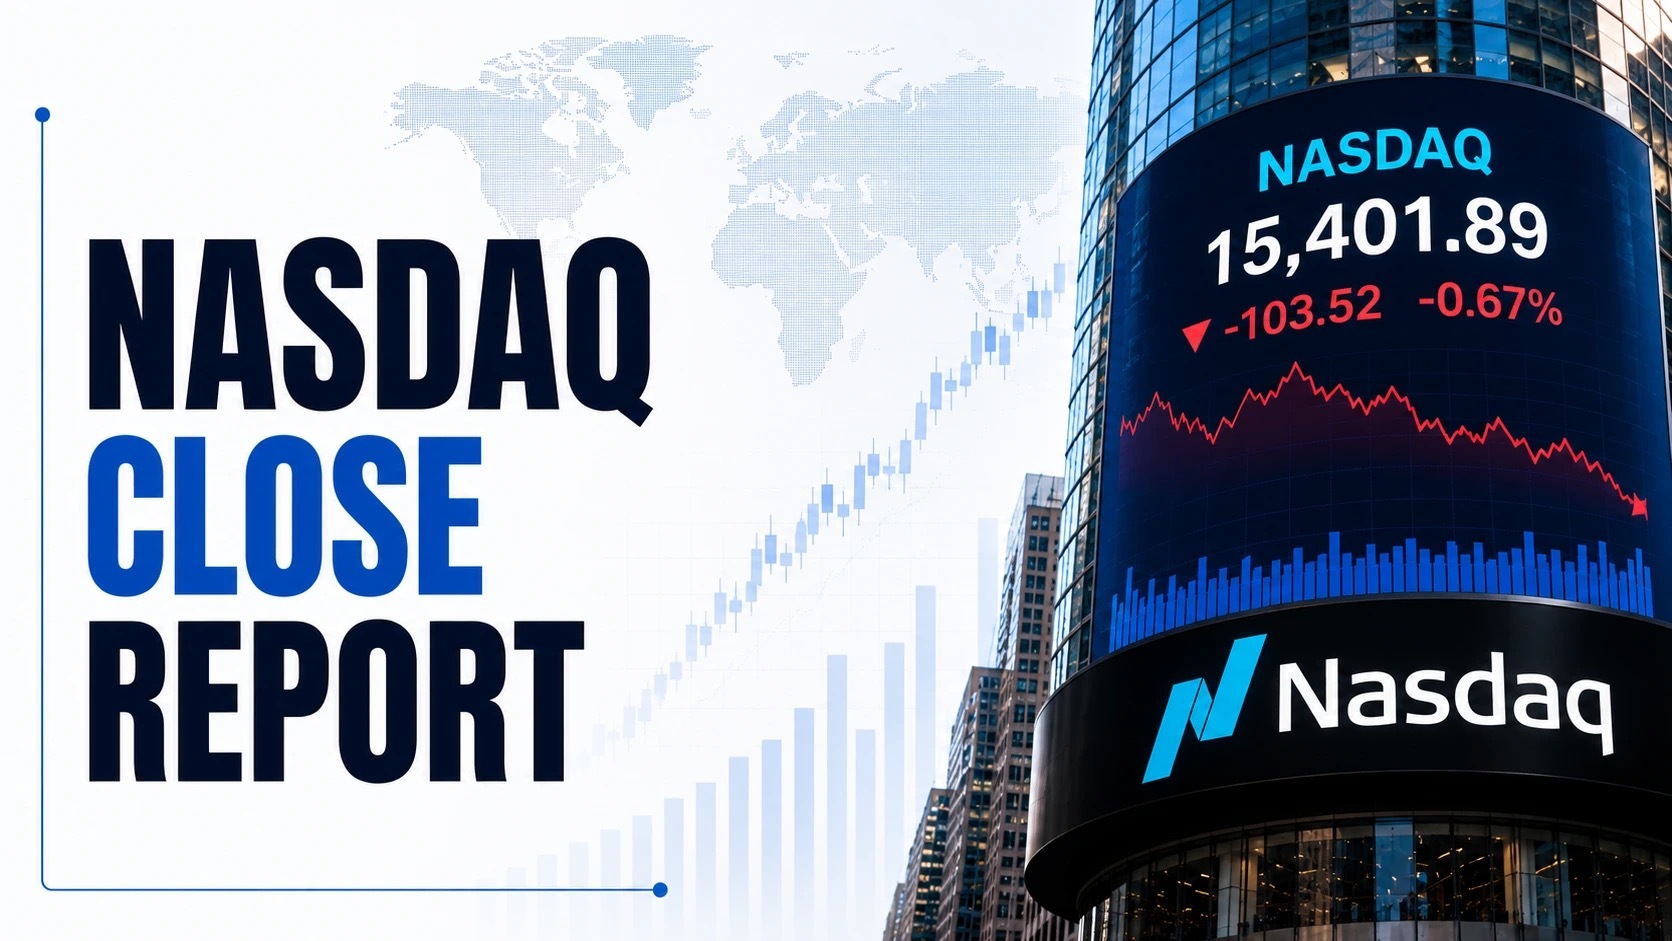
Nasdaq Composite Adds 214.54 Points, Closes at 26,803.03
The technology-focused Nasdaq Composite rose 214.54 points, or 0.81%, to end the session at 26,803.03. The index opened at 26,631.34 and traded within a daily range of 26,612.85 to 26,875.52. The Nasdaq’s outperformance was driven by robust gains in semiconductor and memory-chip stocks, with the Philadelphia Semiconductor Index advancing 1.8% to reach its highest level in nearly a month. Volume on the Nasdaq stood at 6.23 billion shares.
Among the index’s top performers, CoreWeave gained approximately 8%, Netflix rose 3.40%, and Nebius Group advanced 2.92%. The Nasdaq now sits approximately 2% below its record high, having rebounded from a more than 10% decline just two weeks ago.
Dow Jones Industrial Average Adds 69.72 Points, Snaps Three-Day Losing Streak
The Dow Jones Industrial Average gained 69.72 points, or 0.13%, closing at 53,839.99. The blue-chip index opened at 53,828.55 and reached an intraday high of 54,049.14 against a low of 53,622.46. Volume on the Dow stood at 399.5 million shares. The Dow snapped a three-session losing streak, though gains were tempered by declines in select industrial and healthcare components. Among Dow components, Intel and Nvidia were among the top performers, rising 3.72% and 2.94% respectively, as semiconductor strength buoyed the index. Conversely, Home Depot dropped 2.67%, while IBM fell 1.89% and Microsoft declined 1.48%.
Russell 2000 Hits Record 3,067, Extends 23% Year-to-Date Rally
The Russell 2000 Index, which tracks small-cap stocks, rose 7.36 points, or 0.24%, to close at 3,052.85. The index opened at 3,051.09 and touched an intraday high of 3,065.83 against a low of 3,047.08. The small-cap benchmark, which hit an all-time high during the session at 3,067, has now gained over 23% year-to-date. In a sign that investor appetite for risk was increasing and the market’s gains were broadening, the Russell 2000 and S&P 500 equal-weight indexes were also rising further into record territory. The index has now surpassed its previous peak, reflecting renewed optimism in the domestic economic outlook.
S&P 100 Index Rises 0.64% to 3,842.14, Nears 52-Week High
The S&P 100 Index advanced 24.35 points, or 0.64%, closing at 3,842.14. The index opened at 3,825.28 and traded within a range of 3,823.69 to 3,853.17, with the intraday high marking a new 52-week peak for the large-cap index. The S&P 100 has gained approximately 19% over the past 12 months, reflecting the outsized performance of mega-cap technology stocks that dominate the index. The index’s advance was supported by strength in AI-related names, which have been the primary drivers of the broader market’s upward trajectory.
Also Read: How to Invest in S&P 500 Stocks Through Index Funds
Dow Jones Transport Surges 1.50%, Composite and Utility Averages Post Gains
The Dow Jones Composite Average rose 85.59 points, or 0.50%, to close at 17,081.62, having opened at 17,029.72 and touched a high of 17,123.40. The Dow Jones Transportation Average surged 323.40 points, or 1.50%, to end at 21,928.05, reflecting strength in shipping and logistics stocks. The Dow Jones Utility Average added 5.66 points, or 0.51%, closing at 1,109.59.
Philadelphia Semiconductor Index Jumps 1.8% to 12,456.00
The Philadelphia Semiconductor Index (SOX) rose 56.62 points, or approximately 1.8%, to close at 12,456.00. The index opened at 12,413.97 and touched an intraday high of 12,704.38 against a low of 12,398.81. The SOX remains down approximately 15% from its record-high close on June 22. Semiconductor stocks are nearing a bull market, driven by positive momentum that has ignited investor optimism following robust earnings from AI infrastructure companies.
NYSE Composite, S&P MidCap 400 and SmallCap 600 All Finish Higher
The NYSE Composite Index advanced 51.03 points, or 0.21%, to close at 24,809.65, having opened at 24,758.62 and touched a high of 24,865.81. The S&P MidCap 400 Index rose 15.44 points, or 0.40%, to 3,914.43, while the S&P SmallCap 600 Index gained 7.72 points, or 0.43%, closing at 1,819.60.
Flat July PPI Reading Cools Rate-Hike Expectations, Boosts Risk Appetite
The primary catalyst behind Thursday’s broad-based rally was the July Producer Price Index (PPI) report, which showed wholesale inflation coming in cooler than economists had anticipated. Headline PPI remained unchanged month-over-month in July, below the 0.2% increase forecast by economists polled by Dow Jones. Core PPI, which excludes volatile food and energy prices, rose 0.2%, also below the 0.3% expected gain. On a year-over-year basis, headline PPI rose 4.7%, down from June’s revised 5.5% print.
The tame wholesale inflation reading followed Wednesday’s in-line Consumer Price Index (CPI) report, which showed headline CPI rising 0.1% month-over-month and 3.4% year-over-year. Core CPI increased 0.2% in July after remaining unchanged in June, with the year-over-year core CPI rising 2.5%, down from 2.6% in June. Together, the two reports have reinforced the view that inflation pressures are moderating, reducing the urgency for the Federal Reserve to raise rates at its September meeting.
Fed Rate-Hike Bets Fall to 35% as Warsh Faces Divided Committee
According to the CME FedWatch Tool, traders are now pricing in a 65% probability that the central bank will keep rates unchanged next month, up from approximately 45% one week ago. The probability of a 25-basis-point rate hike has fallen to approximately 35%, down from 55% just a week ago.
Cleveland Federal Reserve Bank President Beth Hammack, who was one of three dissenters at the June meeting who voted to raise rates, doubled down on her view that the central bank should raise rates immediately to bring down inflation. “It’s really critical we act now to bring inflation back to the target level,” Hammack said at the Dayton Area Chamber of Commerce.
VIX Drops 5% to Seven-Month Low of 14.45
The CBOE Volatility Index (VIX), commonly referred to as Wall Street’s “fear gauge,” declined to close at 14.45, its lowest level since January. The VIX decreased by approximately 0.8 points, or about 5%, from the previous close. The decline in volatility reflects growing investor confidence that the Federal Reserve is unlikely to tighten monetary policy aggressively in the near term, supported by the recent string of benign inflation data. On Wednesday, the VIX had closed at 15.28, down 1.2% from the prior session.
Information Technology and Real Estate Lead with 1.06% and 1.08% Gains
Eight of the 11 S&P 500 sectors finished in positive territory on Thursday. The Information Technology sector was the best performer, advancing approximately 1.06%, driven by strength in semiconductor and AI-infrastructure names. The Real Estate sector followed closely, rising 1.08%.
The Utilities sector gained approximately 0.5%, while Consumer Staples advanced 0.37% and Health Care rose 0.32%. The Consumer Discretionary sector was the worst performer, declining 1.40%, followed by Materials, which fell 1.19%. Communication Services also declined approximately 0.94% on the session.
Dell Surges 9.87% While Coterra Energy Tumbles 8.62%
Among the S&P 500’s top gainers, Dell Technologies surged approximately 9.87% to 484.50. CoreWeave gained approximately 8%, while Nebius Group advanced approximately 34% on the session. Netflix rose 3.40%, AppLovin gained 3.09%, and Western Digital advanced 2.59%.
On the losing side, Coterra Energy declined 8.62% to 32.56, while Texas Pacific Land fell 6.08% to 342.77. Cencora dropped 5.90% to 314.17, and First Solar declined 5.87% to 226.77.
Also Read: How to Invest in the US Stocks From India
Tesla Leads Magnificent Seven with 3.79% Gain, Amazon Falls 0.81%
All of the Magnificent Seven tech giants except Amazon ended higher on Thursday. Tesla led the group’s advances at approximately 3.79%. Meta Platforms rose 2.77%, while Apple gained 1.00% and Microsoft advanced 0.90%. Nvidia added 0.52%, and Alphabet (GOOGL) rose 0.82%. Amazon, however, bucked the trend, declining 0.81% on the session.
Semiconductor Stocks Extend Rebound as Memory Names Surge
Semiconductor stocks extended their recent rebound, with the broader semiconductor index advancing 1.8% to reach its highest level in nearly a month. Memory-chip names were among the top performers, with Sandisk surging approximately 14%, Seagate Technology gaining over 7%, and Western Digital advancing 7.31%. SK Hynix ADRs rose approximately 7.7%, while Micron Technology added 4.23%. The outperformance in semiconductor stocks reflects continued investor optimism around artificial intelligence infrastructure spending and easing concerns over demand sustainability.
Financial Stocks Show Mixed Performance as Regional Banks Gain
Financial stocks showed mixed performance on Thursday. JPMorgan declined 0.57%, while Bank of America fell 1.11% and Wells Fargo dropped 0.90%. However, Goldman Sachs gained 0.52%, Morgan Stanley rose 0.34%, and Citigroup added 0.83%. Visa advanced 1.68% and Mastercard rose 1.31%, while BlackRock gained 1.89%.
Energy Stocks Underperform as Crude Oil Prices Plunge
Energy stocks underperformed on Thursday as crude oil prices declined sharply. Exxon Mobil fell 0.68%, while Chevron managed a modest gain of 0.56%. ConocoPhillips and Marathon Petroleum also traded lower, reflecting the broader weakness in the energy sector as oil prices reversed course after a week of gains.
AI and Growth Stocks: CoreWeave and Nebius Lead the Charge
AI infrastructure and growth stocks were among the day’s top performers, with CoreWeave surging approximately 19% after the AI cloud company lifted its annual capital spending forecast and topped second-quarter earnings estimates. Nebius Group jumped 34%, helped by second-quarter results that beat expectations. Super Micro Computer surged approximately 19% after the AI server maker forecast fiscal 2027 revenue above Wall Street expectations. Dell Technologies rose nearly 10%, while Micron Technology added over 4%.
July PPI Flat as Wholesale Inflation Cools More Than Expected
The July Producer Price Index (PPI) report, released Thursday morning by the Bureau of Labor Statistics, showed wholesale inflation came in cooler than economists had anticipated. Headline PPI remained unchanged month-over-month in July, below the 0.2% increase forecast. Core PPI, which excludes volatile food and energy prices, rose 0.2%, also below the 0.3% expected gain. On a year-over-year basis, headline PPI rose 4.7%, down from June’s revised 5.5% print.
July CPI Matches Expectations with 0.1% Monthly Increase
The July Consumer Price Index (CPI) report, released Wednesday, showed headline CPI rising 0.1% month-over-month, matching economists’ expectations. Year-over-year headline CPI increased 3.4% in July, down from 3.5% in June. Core CPI, excluding food and energy, increased 0.2% in July after remaining unchanged in June. On a year-over-year basis, core CPI rose 2.5% in July, compared with 2.6% in June.
Initial Jobless Claims Rise to 209,000, Continuing Claims Decline
Initial jobless claims for the week ended August 8 rose to 209,000, above economists’ expectations of 202,000 and up from the previous week’s revised tally of 200,000. The four-week moving average of initial claims remained flat at 199,000. Continuing claims, which track the unemployed population still seeking work, fell to 1.777 million in the week ended August 1, below expectations of 1.794 million and down from the prior week’s revised count of 1.799 million.
Treasury Yields Decline as Rate-Hike Expectations Moderate
Treasury yields moved lower on Thursday as traders pared expectations for near-term Federal Reserve rate hikes following the softer inflation data. The 2-year Treasury yield, which is sensitive to the outlook for interest rate policy, fell approximately 5.7 basis points to 4.142%. The benchmark 10-year Treasury yield declined 5.3 basis points to 4.639%, while the 30-year bond yield dropped 3.9 basis points to 5.208%.
Crude Oil Plunges Over 2% on Demand Concerns and Rising U.S. Inventories
Oil prices fell sharply on Thursday, reversing course after a week of gains, as investors focused on signs of weaker global demand and a sharp build in U.S. crude inventories. Brent crude futures settled $1.91, or 2.15%, lower at $87.07 per barrel following a six-session rally. West Texas Intermediate (WTI) crude closed down $2.02, or 2.4%, at $81.25 per barrel. Earlier in the session, Brent slid as much as 3.5%, while WTI fell by as much as 3.8%. The decline in oil prices was attributed to demand concerns and rising U.S. crude inventories, which helped ease inflationary pressures and supported equity markets. Natural gas futures fell about 3% to settle at $2.727 per million British thermal units.
Also Read : US Stock Market Timings
Gold Pulls Back Nearly 1% on Profit-Taking After Two-Month Peak
Gold prices fell nearly 1% on Thursday as investors locked in gains after prices climbed to two-month highs following U.S. inflation data that tempered expectations for a Federal Reserve rate hike next month. Spot gold fell 0.9% to $4,366.38 per ounce, after touching its highest level since June 5 earlier in the session at $4,449.39. U.S. gold futures dipped 1% to $4,423.60. Copper prices edged lower, with benchmark three-month copper on the London Metal Exchange down 0.04% at $14,126.50 per metric ton.
U.S. Dollar Index Edges Lower to 99.95 on Cooling Inflation Data
The U.S. Dollar Index (DXY), which measures the greenback against a basket of six major currencies, slipped 0.1% to 99.95. The dollar’s decline followed the flat PPI reading, which reinforced expectations that the Federal Reserve will hold rates steady, reducing the currency’s yield advantage. The Japanese yen strengthened 0.14% to 159.19 per dollar, while the euro edged higher against the dollar.
The S&P 500’s record close, supported by cooling PPI inflation and declining oil prices, signals a market environment where rate-hike fears have substantially moderated. The VIX’s drop to a seven-month low reflects reduced near-term uncertainty, while the Russell 2000’s continued record run indicates broadening participation beyond mega-cap technology names. Treasury yields and the dollar’s modest declines further underscore shifting expectations around Federal Reserve policy. With the August CPI and PPI reports still ahead before the September Federal Open Market Committee meeting, the inflation trajectory remains the dominant variable shaping market direction.
Source
- https://www.nasdaq.com/
- spglobal.com/spdji/en/indices/equity/sp-500/
- https://www.dowjones.com/
- https://www.spglobal.com/spdji/en/indices/equity/dow-jones-industrial-average/
- https://www.spglobal.com/spdji/en/indices/equity/sp-500/
- https://www.nasdaq.com/market-activity/index/comp
- https://www.nasdaq.com/market-activity/quotes/nasdaq-ndx-index
- https://www.spglobal.com/spdji/en/indices/equity/sp-100/
- https://www.lseg.com/en/ftse-russell/indices/russell-us
- https://www.nyse.com/index
- https://www.nyse.com/index
- https://www.spglobal.com/spdji/en/indices/equity/dow-jones-transportation-average/
- https://www.spglobal.com/spdji/en/indices/equity/dow-jones-utility-average/
- https://www.spglobal.com/spdji/en/indices/equity/dow-jones-composite-average/
- https://www.nasdaq.com/market-activity/index/sox
- https://www.cboe.com/tradable_products/vix/
Disclaimer
If you have any concerns, questions, or wish to point out any discrepancies in our content, please feel free to write to us at content@hdfcsec.com.
Please Note: The information shared is intended solely for informational purposes and does not make any investment recommendations
Disclaimer
At HDFC SKY*, we take utmost care and due diligence in curating and presenting news and market-related content. However, inadvertent errors or omissions may occasionally occur.
If you have any concerns, questions, or wish to point out any discrepancies in our content, please feel free to write to us at content@hdfcsec.com.
Please Note: The information shared is intended solely for informational purposes and does not make any investment recommendations.
HDFC SKY from HDFC Securities, one of most trusted trading platforms in India, has been recognized with the *Next-Gen Digi Content Awards 2025-26.
 Join Us
 Add as preferred source on Google


More International News








Open Free Demat Account
Open Free Demat Account









Invest Anytime, Anywhere


By signing up I certify terms, conditions & privacy policy