Nifty 50
- Bajaj Finance₹942.1016.10 (1.74%)
- HDFC Life Insurance ₹522.05-17.60 (-3.26%)
- ICICI Bank₹1,395.9010.90 (0.79%)
- Nestle₹1,185.20-38.70 (-3.16%)
- Bajaj Auto₹10,15078.00 (0.77%)
- Eternal₹304.55-7.80 (-2.50%)
- Sun Pharmaceutical₹1,75812.90 (0.74%)
- Tata Motors PV₹269.35-6.35 (-2.30%)
- SBI₹9707.00 (0.73%)
- Tech Mahindra₹1,800-34.70 (-1.89%)
- UltraTech Cement₹10,91869.00 (0.64%)
- HDFC Bank₹693.70-13.25 (-1.87%)
- L&T₹3,655.1019.10 (0.53%)
- Adani Enterprises₹2,547-47.50 (-1.83%)
- BSE₹3,264.9016.60 (0.51%)
- Trent₹2,771-51.00 (-1.81%)
- Cipla₹1,320.606.60 (0.50%)
- Hindustan Unilever₹1,817.60-32.60 (-1.76%)
- Apollo Hospitals₹7,62626.00 (0.34%)
- Bharat Electronics₹364.95-6.25 (-1.68%)

- Offerings
- Tools & Platforms
Tools & Calculators
- Open API
- Calculators
- SIP Calculator
- CAGR Calculator
- Compound Interest Calculator
- FD Calculator
- RD Calculator
- EPF Calculator
- Retirement Calculator
- HDFC SIP Calculator
- Mutual Fund Return Calculator
- Lumpsum Calculator
- Step Up SIP Calculator
- ETF SIP Calculator
- Brokerage Calculator
- Equity Margin Calculator
- SWP Calculator
- EMI Calculator
- MTF Calculator
- Margin Pledge Calculator
- Algo Strategy
- Markets
Stocks
F&O
Mutual Funds
- More
- What Is Automated F&O Market Nudges on HDFC SKY?
- What Triggers an F&O Market Nudge?
- How SKY Signals Helps You Spot and Validate Market Moves
- What to Check Before Turning a Signal Into an F&O Trade
- Review F&O Research
- Examine the Options Setup
- Assess Payoff and Greeks
- How HDFC SKY Helps You Act on an F&O Setup
- Where Automation Fits Into the F&O Workflow
- Using F&O Nudges Without Treating Them as Trade Guarantees
- Conclusion
Automated F&O Market Nudges on HDFC SKY: Daily Signals Delivered to You
By HDFC SKY | Published at: Oct 22, 2026 03:15 PM IST
Open Free Demat Account
Open Free Demat Account
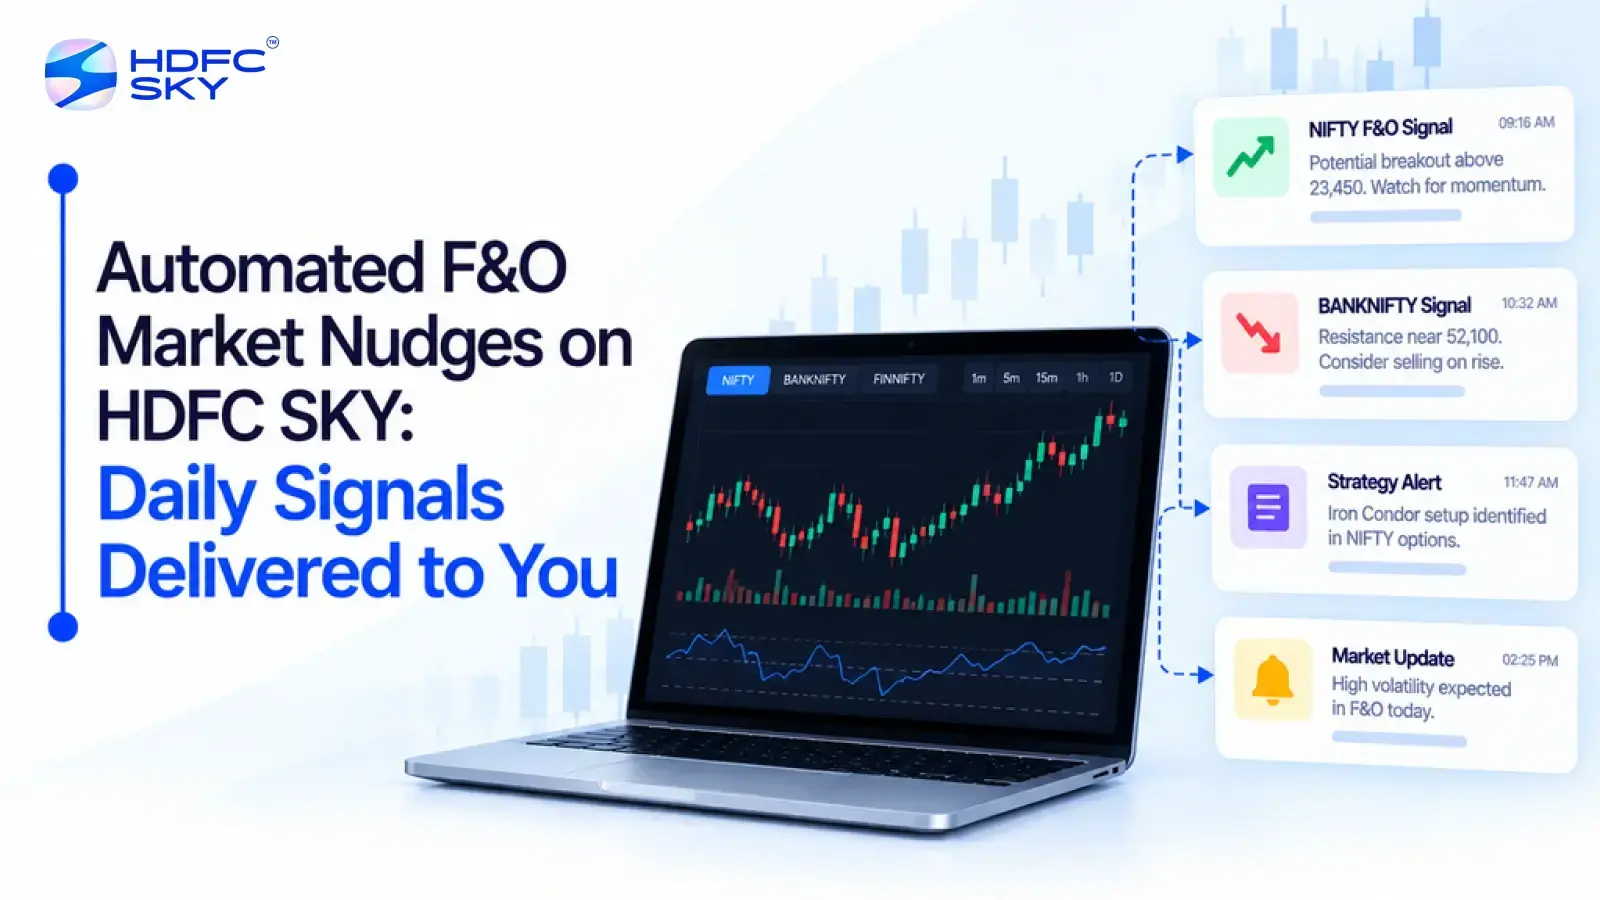
Futures and options (F&O) markets can change fast which makes it hard for traders to monitor it all the time. Price changes, chart patterns, news, and events can develop while traders are looking at positions or doing research. SKY Signals by HDFC Sky brings selected market updates to traders through signals and alerts. Traders can then use HDFC SKY’s F&O research, analysis, and trading tools to evaluate the setup before deciding if they want to take a trade.
What Is Automated F&O Market Nudges on HDFC SKY?
An F&O market nudge is a timely signal that draws attention to a market condition that may warrant further analysis. It can relate to a technical indicator, candlestick pattern, price or volume movement, research recommendation, news update, or corporate event.
SKY Signals on HDFC Sky brings these different types of information into its trading ecosystem. It can highlight technical signals, candlestick patterns, price and volume activity, research recommendations, news, and corporate events. Smart alerts can also notify traders when selected indicator formations or pattern-based triggers occur.
A nudge is not an automatic trade instruction. SKY Signals highlights information; the trader decides whether the underlying setup merits further examination. F&O research and analytical tools then provide additional information before execution.
This distinction separates three stages of the process: spotting a market development, evaluating the opportunity, and placing a trade.
What Triggers an F&O Market Nudge?
SKY Signals uses different types of market information to identify conditions that may deserve attention.
Technical Indicators
Technical signals can highlight conditions such as MACD crossovers, price movements around moving averages, and support or resistance breakouts. These indicators can help traders identify changes in price behaviour.
Candlestick Patterns
SKY Signals can identify recognised candlestick formations, including Shooting Star, Bearish Harami, and Bearish Engulfing patterns. Such formations can draw attention to potential changes in price direction, but traders need to examine the surrounding market context before acting.
Price and Volume
Significant changes in price and trading volume can provide additional information about market activity. Bringing these signals into the same monitoring environment can help traders identify securities that warrant closer examination.
News and Corporate Events
Price movements can also follow developments outside technical charts. Earnings announcements, corporate actions, and other market events can affect a security.
SKY Signals includes news and corporate event information alongside technical signals, allowing traders to investigate whether a market move has a relevant event behind it.
How SKY Signals Helps You Spot and Validate Market Moves
Once a relevant condition emerges, SKY Signals presents it through the platform rather than requiring traders to identify every trigger manually.
The signals appear within a unified dashboard, while chart-based visualisation can help traders see the technical indicator or pattern in the context of the underlying price movement.
Smart alerts add another monitoring layer by notifying traders when specified indicator formations or pattern-based triggers occur.
The trader can, therefore, move from notification to verification:
- A signal or alert identifies a market condition.
- The trader opens the relevant security or index.
- The trader checks the signal against the chart and current price behaviour.
- If the setup remains relevant, the trader moves to F&O-specific analysis.
- The purpose of this stage is to establish what happened in the market before considering a derivative position.
What to Check Before Turning a Signal Into an F&O Trade
A market signal alone does not describe the complete derivative setup. Traders need to examine the relevant futures or options information before deciding whether to take a position. HDFC SKY provides F&O research and analytical tools for this stage.
Review F&O Research
HDFC SKY’s derivatives research covers futures and options recommendations. Research pages can provide details such as the recommendation, entry price, target price, stop loss, current price, and call status.
This information can help traders assess a research-based view alongside the market signal rather than treating the signal itself as a trade recommendation.
Examine the Options Setup
For options, traders can review information such as option prices, open interest, volume, and the Put-Call Ratio. HDFC SKY also provides tools for building and analysing options strategies.
This allows traders to examine the specific contract or strategy that could follow from the underlying market view.
Assess Payoff and Greeks
The Position Analyzer provides a trade summary, payoff graph, payoff data, and options Greeks. Traders can also adjust the underlying price and target date to examine how the potential payoff changes under different scenarios. This stage connects the initial market signal with the characteristics of the proposed F&O position.
How HDFC SKY Helps You Act on an F&O Setup
After completing the analysis, traders can use HDFC SKY’s execution tools to place or manage the selected F&O position.
- The platform includes tools such as the futures and options chain, Quick Options, open-interest analysis, market movers and scanners, Payoff Analyzer, Strategy Builder, and Auto Order Slicer.
- For complex strategies, KART orders allow traders to create orders containing equity and derivative scripts. This can support multi-leg F&O strategies without treating each leg as an entirely separate execution task.
- GTT orders can help traders set predefined conditions for order execution, while Auto Order Slicer can divide larger orders into smaller lots.
- HDFC SKY also supports TradingView-based execution, allowing traders to move from chart analysis towards order placement within the available trading workflow.
These tools address the execution stage. They do not change what triggered the original SKY Signal.
Where Automation Fits Into the F&O Workflow
Automation becomes relevant when a trader has already defined the conditions under which an order should be placed, modified, or managed.
HDFC SKY provides API-based trading capabilities that allow users to connect their strategies to the trading platform. Its ecosystem also supports integrations and workflows involving tools such as OpenAlgo, TradingView webhooks, Python-based strategies, and Amibroker.
The distinction between signals and automation remains important:
- SKY Signals surfaces market information.
- F&O research provides research-based recommendations and derivative information.
- Analysis tools help examine a potential position.
- Execution tools help place and manage orders.
- APIs and automation allow predefined rules to control parts of the execution process.
Automation can handle predefined instructions once those rules exist. It does not turn every market nudge into an automatic trade.
Using F&O Nudges Without Treating Them as Trade Guarantees
A signal identifies a condition; it does not guarantee what happens next. Price behaviour can change after a technical pattern appears, and an expected market move may not occur.
Traders should, therefore, use nudges as prompts for investigation rather than as standalone trade instructions.
Several factors can affect the outcome after a signal appears:
- Technical patterns can fail or reverse.
- Market-moving news can change an existing setup.
- Rapid price movements can alter an F&O position quickly.
- Options prices can respond to changes in volatility, time to expiry, and the underlying price.
- Leverage can magnify both gains and losses.
- Automated execution can follow predefined rules even when broader market conditions have changed.
SEBI’s study of individual equity F&O traders found that 93% incurred losses between FY22 and FY24, with aggregate losses exceeding ₹1.8 lakh crore during the three-year period.
For this reason, traders should assess the underlying setup, understand the potential payoff and risk, and define their trading conditions before using either manual or automated execution.
Conclusion
HDFC SKY combines market signals, F&O research, analysis tools, and automation features in one environment. These tools can help traders monitor markets and act on predefined conditions. However, a signal does not guarantee a profitable trade. Traders should validate setups, understand the risks, and use automation within a trading plan.



Open Free Demat Account
Open Free Demat Account
Popular Posts
- 10 Interesting Facts About NSE You Probably Didn’t KnowLast Updated: Sep 30, 2026
- 8-4-3 Rule of SIP - How Does That Work?Last Updated: Jul 30, 2025
- Let's view more exciting Post!
Popular Post from Derivatives
- How to Set Up Scalper Mode on Web for Nifty & Bank Nifty OptionsLast Updated: Oct 22, 2026
- Scalper Mode Now on HDFC SKY Web: One-Click Trading for Fast MarketsLast Updated: Oct 22, 2026
- Trade Directly from Charts on HDFC SKY: Place, Modify, and Track Orders Without Leaving the ChartLast Updated: Oct 22, 2026
- How to Execute an Iron Condor or Straddle from the Option Chain Basket on HDFC SKYLast Updated: Oct 22, 2026
- Option Chain Basket Orders on the HDFC Sky App: Build Multi-Leg Strategies in One GoLast Updated: Oct 22, 2026
- Let's view more exciting Post!
Popular Post from Blogs
- “Bounce Back” Theme Gains Traction in 2026Last Updated: Apr 8, 2026
- 5 Takeaways for Tax Payers from the Budget 2025Last Updated: Jan 29, 2026
- Let’s view more exciting Posts


Invest Anytime, Anywhere


By signing up I certify terms, conditions & privacy policy