Nifty 50
- Tech Mahindra₹1,57160.70 (4.02%)
- Hindalco Industries₹945.10-14.20 (-1.48%)
- Kotak Mahindra Bank₹390.7013.55 (3.59%)
- Dr. Reddy's Labs₹1,210.30-14.10 (-1.15%)
- Jio Financial ₹242.707.05 (2.99%)
- Wipro₹175.90-1.84 (-1.04%)
- TCS₹2,26564.00 (2.91%)
- Sun Pharmaceutical₹1,934-16.10 (-0.83%)
- Reliance Industries₹1,32932.40 (2.50%)
- Apollo Hospitals₹8,820-68.00 (-0.77%)
- ICICI Bank₹1,45233.80 (2.38%)
- Max Healthcare₹1,090-8.20 (-0.75%)
- Hindustan Unilever₹2,14344.60 (2.13%)
- Bharti Airtel₹1,908-13.80 (-0.72%)
- Eicher Motors₹7,569150.50 (2.03%)
- Cipla₹1,419.50-10.00 (-0.70%)
- Mahindra & Mahindra₹3,178.9061.10 (1.96%)
- Trent₹2,842-18.20 (-0.64%)
- Bajaj Finance₹1,055.3017.70 (1.71%)
- HDFC Life Insurance ₹564-3.60 (-0.63%)
- Offerings
- Tools & Platforms
Tools & Calculators
- Open API
- Calculators
- SIP Calculator
- CAGR Calculator
- Compound Interest Calculator
- FD Calculator
- RD Calculator
- EPF Calculator
- Retirement Calculator
- HDFC SIP Calculator
- Mutual Fund Return Calculator
- Lumpsum Calculator
- Step Up SIP Calculator
- ETF SIP Calculator
- Brokerage Calculator
- Equity Margin Calculator
- SWP Calculator
- EMI Calculator
- MTF Calculator
- Margin Pledge Calculator
- Markets
Stocks
F&O
Mutual Funds
- More
- What Is the Buffett Indicator?
- How the Buffett Indicator Works in India
- What the Buffett Indicator Suggests About Indian Markets Today
- Why Indian Markets Often Stay “Expensive” for Long Periods
- Limitations of the Buffett Indicator
- What Investors Should Really Focus on Instead
- Buffett Indicator vs Reality in India
- Conclusion
What the Buffett Indicator Says About Indian Market Valuations Right Now and Its Limitations
By Aseem Shrivastava | Published at: Jun 3, 2026 12:55 PM IST
Investors often hear that markets are expensive, but few understand how this conclusion is reached. One popular tool used globally is the Buffett Indicator, which compares the total stock market value with GDP. It offers a quick snapshot of valuation levels. In India, where markets have grown rapidly in recent years, this indicator often sparks debate about whether current valuations are justified or stretched. This makes it widely discussed today globally.
What Is the Buffett Indicator?
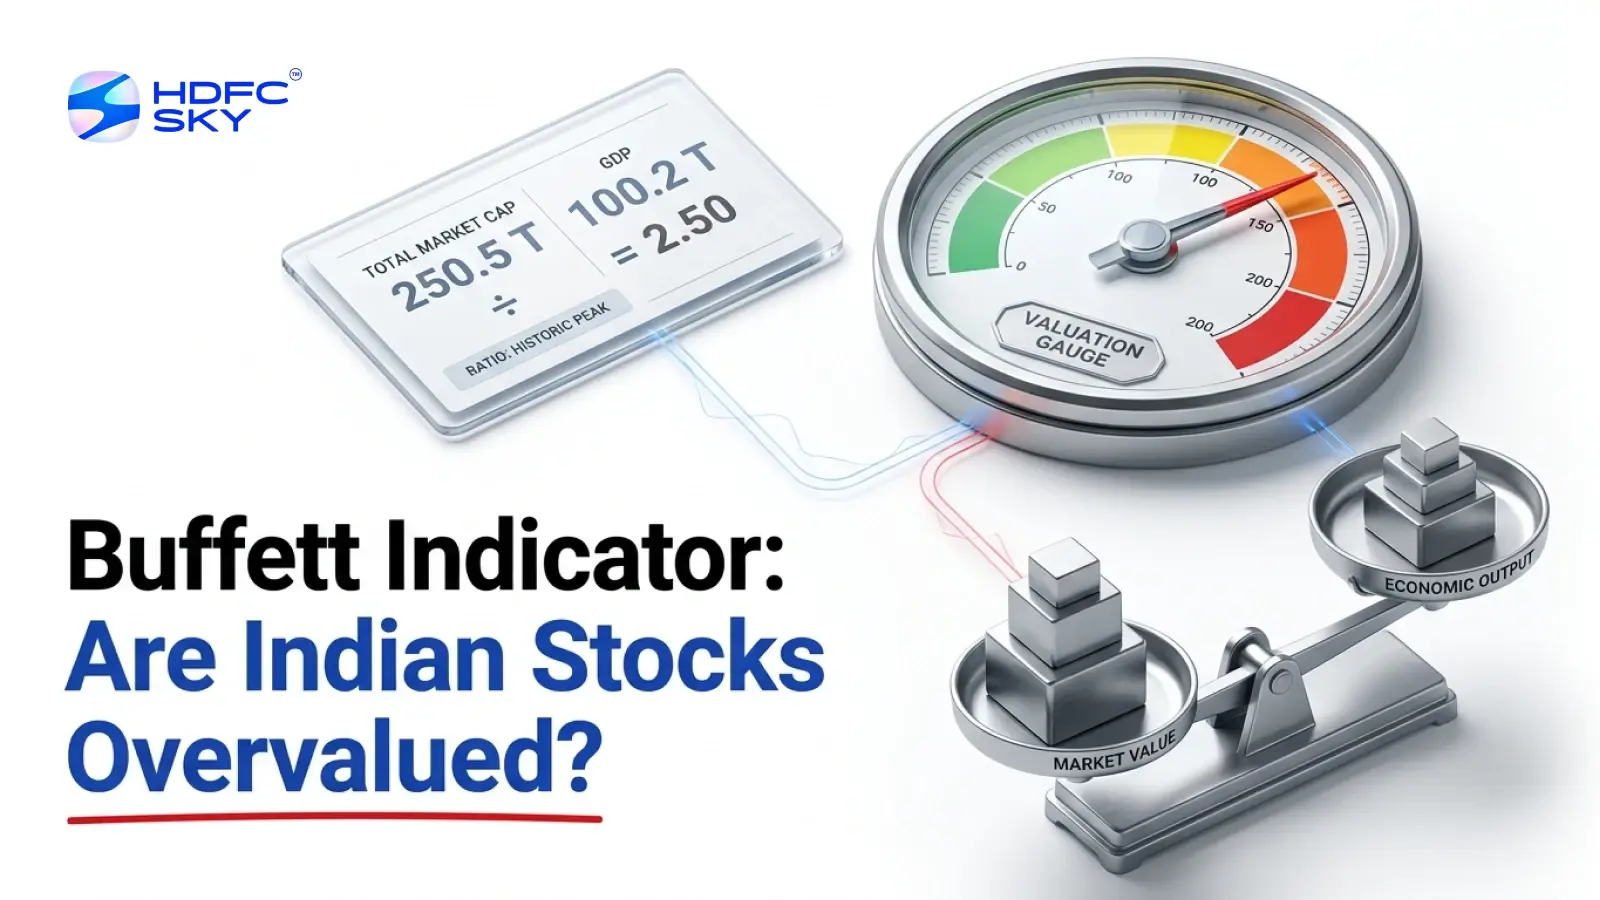
The Buffett Indicator is a simple way to measure whether a stock market looks expensive or cheap. It compares the total value of all listed companies in a country with the size of its economy, measured by GDP. Warren Buffett popularised this idea as a long-term valuation check for markets.
If the stock market value grows much faster than GDP, it may signal high valuations. If it grows more slowly, it may indicate undervaluation. The strength of this indicator lies in its simplicity, as it gives a broad view of how the market compares with real economic output. It helps investors quickly sense the overall market mood across different time periods globally.
Also Read: What is “yield curve inversion” and why does it make economists nervous about India’s growth?
How the Buffett Indicator Works in India
In India, the Buffett Indicator reflects how fast markets have expanded compared to economic growth.
- Market Cap Expansion Drivers
India’s stock market value has grown faster than its GDP in recent years. Strong retail participation has increased inflows into equities. Foreign institutional investors also add significant capital during growth phases. The rise of technology and financial services companies has further boosted total market capitalisation. - Key Growth Influences
India’s consumption-led economy supports earnings growth across sectors. Banking, IT, and manufacturing play a major role in expanding corporate profits. Rising financial inclusion brings more people into formal investment systems, increasing market depth. - Interpretation of Ratio Levels
When the ratio rises above historical averages, markets may appear expensive. When it falls below, markets may look undervalued. A moderate range usually signals balanced valuation conditions.
What the Buffett Indicator Suggests About Indian Markets Today
The Buffett Indicator gives a broad sense of valuation levels in Indian markets today.
- High Ratio Scenario
If the market cap to GDP ratio stays high, it suggests that investors expect strong future earnings. This can signal an overheated market, though it may also reflect confidence in long-term growth. - Moderate Range
When the ratio stays in a moderate zone, it signals balanced valuations. Markets move in line with earnings growth and economic expansion. - Low Ratio
When the ratio is low, it may indicate undervaluation. Investors often see such periods as long-term entry opportunities.
Why Indian Markets Often Stay “Expensive” for Long Periods
Indian markets often remain expensive for long periods due to structural growth drivers.
- Strong GDP growth expectations keep investors willing to pay higher prices.
- Higher corporate earnings growth supports premium valuations.
- India’s large domestic consumption base strengthens long-term demand visibility.
- Expanding financial inclusion increases market participation.
- Global investors often assign a growth premium to India.
Limitations of the Buffett Indicator
The Buffett Indicator has important limitations when applied to India’s market structure.
- It Ignores Global Earnings
The indicator does not consider that many Indian companies earn a large share of revenue from global markets. This can distort valuation comparisons because GDP reflects only domestic activity, while company earnings often depend on international performance and demand. - GDP Mismatch
GDP measures current economic output, not future profit expectations. Stock prices, however, reflect investor expectations about future growth and earnings. This gap makes the Buffett Indicator less accurate in fast-growing economies like India, where future potential matters more than present output. - Informal Economy Factor
India’s large informal economy is not fully captured in official GDP figures. Many small businesses and unregistered activities contribute significantly to real economic activity. This makes GDP appear smaller than the true economy, affecting the accuracy of valuation comparisons. - Sector Bias
Indian markets are heavily weighted toward financial services and technology companies. These sectors often trade at higher valuations due to growth expectations. This concentration can distort the overall market-cap-to-GDP ratio, making the market appear more expensive than it actually is. - Interest rate environment
Interest rates strongly influence market valuations regardless of fundamentals. Lower rates increase liquidity and push valuations higher, while higher rates reduce them. The Buffett Indicator does not adjust for these monetary conditions, making it less reliable during changing interest rate cycles.
What Investors Should Really Focus on Instead
Investors should focus on real drivers of market performance rather than relying only on valuation ratios.
- Earnings growth of companies
- Interest rate direction (RBI policy impact)
- Sector performance trends
- Foreign institutional investment flow
- Domestic demand strength
These factors give a clearer picture of market direction. They help investors understand both short-term movements and long-term trends. Combining them provides a more practical approach than using a single ratio.
Buffett Indicator vs Reality in India
Buffett Indicator vs Reality in India shows how theory and actual market behavior differ.
| Aspect | Buffett Indicator View | India Market Reality |
| Valuation signal | Over/undervalued based on ratio | Driven by earnings and growth expectations |
| Market timing | Suggests extremes | Not reliable for short-term timing |
| Economic link | Direct comparison with GDP | Influenced by global earnings and capital flows |
It helps in a long-term valuation sense check, but fails in short-term timing. India’s growth often justifies higher valuations than developed markets.
Conclusion
The Buffett Indicator offers a simple way to view market valuation, but it does not tell the full story. In India, strong growth and structural changes often support higher valuations. Investors should use it as a guide, not a rule, while focusing on broader economic and earnings trends over time.


By signing up I certify terms, conditions & privacy policy