Broad Market and Sectoral Indices Weaken on June 1, 2026; Nifty IT Gains 2.66%
Authored By HDFC SKY | Published at: Jun 1, 2026 05:01 PM IST
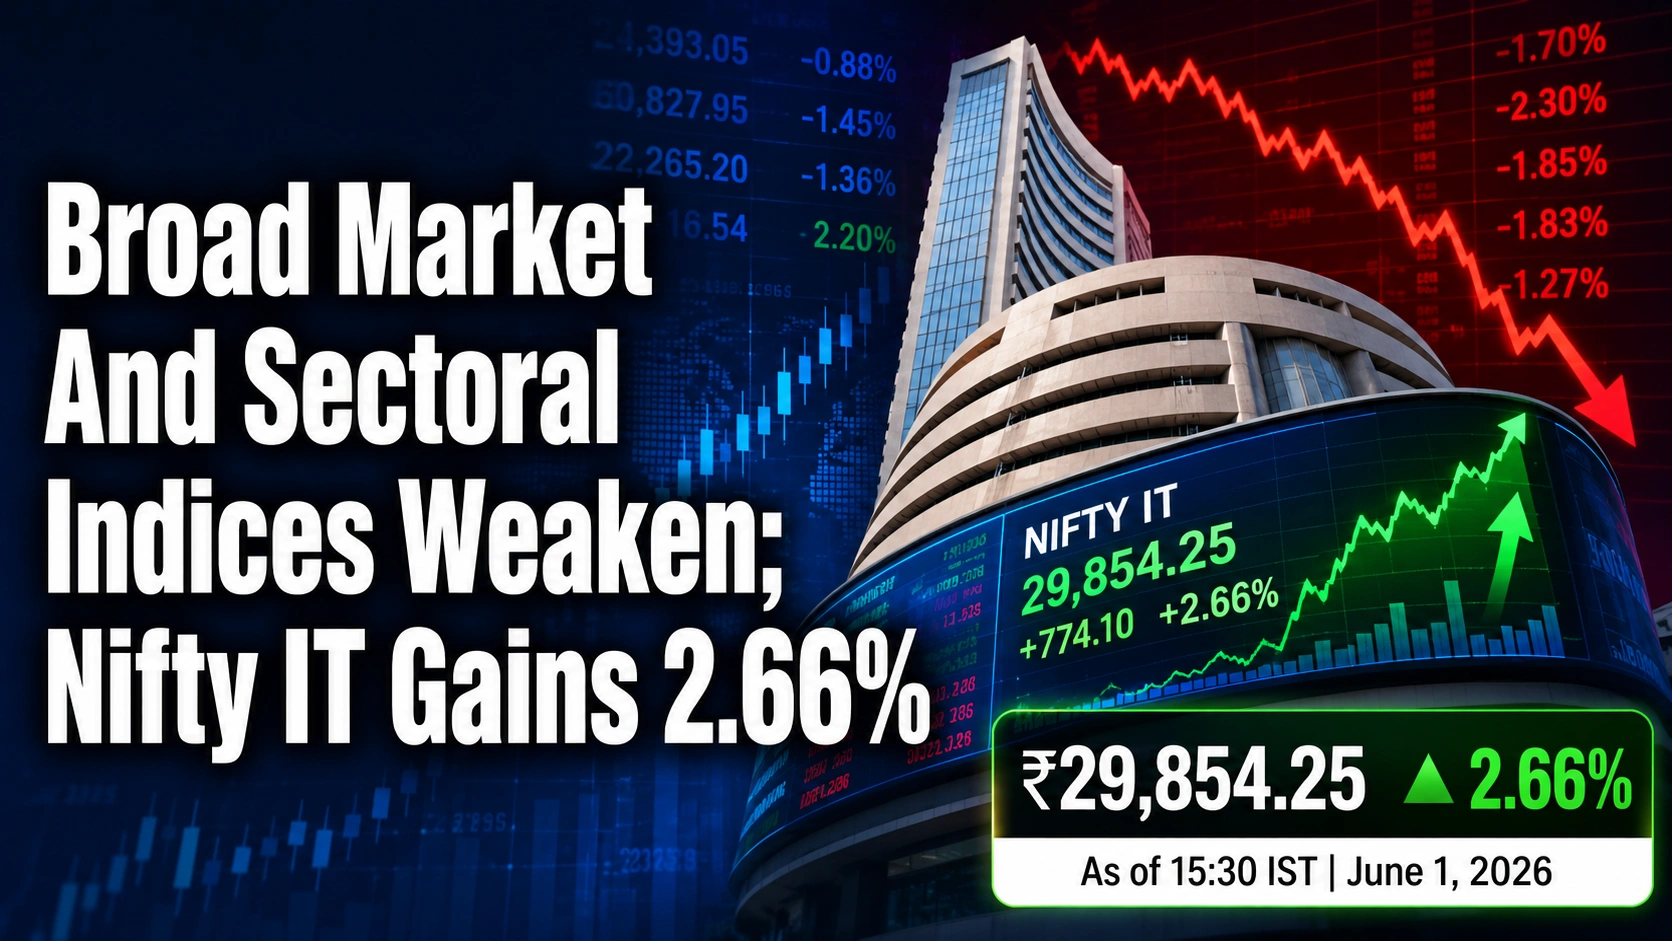
Broad-based selling pressure weighed on Indian equities on June 1, 2026, with most broad market and sectoral indices ending lower, while Nifty IT, Media and Metal bucked the trend.
Mumbai, June 1: Indian equities witnessed broad-based weakness on June 1, 2026, with most broad market and sectoral indices ending in negative territory, while select technology, media and metal stocks provided support, according to exchange data.
Among broad market indices, Nifty Midcap 100 registered the steepest decline, falling 1.45%, followed by Nifty Midcap 150, which lost 1.36%. The India VIX rose 2.20%, indicating an increase in market volatility during the session.
Sectoral performance remained mixed. Nifty FMCG emerged as the weakest major sectoral index with a decline of 2.30%, while Nifty IT outperformed the market with a gain of 2.66%.
Broad Market Indices Performance As On June 1, 2026, 15:30 IST
| INDEX NAME | LAST | CHNG | %CHNG | P/E | P/B | DIV YIELD |
| NIFTY 100 | 24,393.05 | -215.40 | -0.88 | 20.07 | 3.31 | 1.36 |
| NIFTY 200 | 13,528.35 | -135.35 | -0.99 | 21.47 | 3.53 | 1.21 |
| NIFTY 500 | 22,437.95 | -219.05 | -0.97 | 22.45 | 3.57 | 1.14 |
| NIFTY MIDCAP 50 | 17,279.20 | -211.35 | -1.21 | 32.84 | 4.76 | 0.55 |
| NIFTY MIDCAP 100 | 60,827.95 | -895.85 | -1.45 | 29.76 | 4.83 | 0.62 |
| NIFTY SMALLCAP 100 | 17,979.80 | -159.00 | -0.88 | 30.54 | 3.52 | 0.67 |
| INDIA VIX | 16.54 | 0.35 | 2.20 | – | – | – |
| NIFTY MIDCAP 150 | 22,265.20 | -306.20 | -1.36 | 28.92 | 4.79 | 0.66 |
| NIFTY SMALLCAP 50 | 8,882.00 | -69.35 | -0.77 | 30.16 | 3.38 | 0.68 |
| NIFTY SMALLCAP 250 | 16,857.10 | -135.00 | -0.79 | 33.67 | 3.61 | 0.71 |
| NIFTY MIDSMALLCAP 400 | 20,276.15 | -239.70 | -1.17 | 30.35 | 4.32 | 0.68 |
| NIFTY500 MULTICAP 50:25:25 | 15,818.90 | -156.05 | -0.98 | 24.43 | 3.67 | 1.02 |
| NIFTY LARGEMIDCAP 250 | 16,121.20 | -183.45 | -1.13 | 23.86 | 3.94 | 0.99 |
Source: Exchange data, as of 15:30 IST, June 1, 2026.
Sectoral Indices Show Divergent Trends
While most sectors ended lower, information technology stocks stood out as the strongest performers. Nifty IT advanced 774.10 points, or 2.66%, making it the best-performing sector during the session.
Media and metal shares also outperformed broader markets, with Nifty Media rising 1.37% and Nifty Metal gaining 0.49%.
On the downside, Nifty FMCG dropped 2.30%, followed by Nifty PSU Bank, down 1.85%, Nifty Realty, down 1.83%, and Nifty Auto, which fell 1.70%.
Sectoral Indices Performance As On June 1, 2026, 15:30 IST
| INDEX NAME | LAST | CHNG | %CHNG | P/E | P/B | DIV YIELD |
| NIFTY AUTO | 25,891.90 | -446.55 | -1.70 | 30.43 | 4.51 | 1.30 |
| NIFTY FINANCIAL SERVICES 25/50 | 27,277.35 | -393.75 | -1.42 | 16.07 | 2.82 | 1.01 |
| NIFTY FMCG | 48,247.70 | -1,135.65 | -2.30 | 34.04 | 8.55 | 0.91 |
| NIFTY IT | 29,854.25 | 774.10 | 2.66 | 19.79 | 5.40 | 3.88 |
| NIFTY MEDIA | 1,427.55 | 19.25 | 1.37 | 34.39 | 1.48 | 1.25 |
| NIFTY METAL | 13,506.55 | 65.60 | 0.49 | 20.06 | 3.52 | 1.53 |
| NIFTY PHARMA | 24,214.25 | -131.55 | -0.54 | 37.61 | 5.31 | 0.67 |
| NIFTY PSU BANK | 8,005.50 | -150.65 | -1.85 | 7.91 | 1.30 | 2.38 |
| NIFTY PRIVATE BANK | 26,068.00 | -258.40 | -0.98 | 17.30 | 2.09 | 0.61 |
| NIFTY REALTY | 768.20 | -14.35 | -1.83 | 34.32 | 3.75 | 0.38 |
| NIFTY HEALTHCARE INDEX | 15,267.20 | -125.55 | -0.82 | 40.28 | 5.77 | 0.56 |
| NIFTY CONSUMER DURABLES | 34,500.20 | -443.35 | -1.27 | 62.03 | 11.24 | 0.40 |
| NIFTY OIL & GAS | 11,159.10 | -41.15 | -0.37 | 8.99 | 1.55 | 2.32 |
| NIFTY MIDSMALL HEALTHCARE | 47,557.90 | -223.70 | -0.47 | 43.47 | 5.89 | 0.42 |
Source: Exchange data, as of 15:30 IST, June 1, 2026.
Valuation Trends Across Market Segments
Valuation multiples remained elevated in several consumption and healthcare-linked segments despite the decline in share prices. Nifty Consumer Durables traded at a P/E ratio of 62.03, the highest among the tracked sectoral indices.
Healthcare-oriented indices also commanded premium valuations, with Nifty Healthcare Index trading at 40.28 times earnings and Nifty MidSmall Healthcare at 43.47 times earnings.
In contrast, Nifty PSU Bank and Nifty Oil & Gas continued to trade at comparatively lower valuation levels, with P/E multiples of 7.91 and 8.99, respectively.
The India VIX increase suggests market participants priced in higher near-term uncertainty amid the broader decline.
Conclusion
Indian equities closed June 1, 2026, on a cautious note as weakness across broad market, banking, consumption and real estate segments outweighed gains in technology, media and metal stocks.
The Nifty IT share price index emerged as the strongest performer with a 2.66% gain, while Nifty FMCG recorded the sharpest sectoral decline. Rising volatility, as reflected by the India VIX, indicated a more risk-averse trading environment heading into subsequent sessions.
Source:
- https://www.nseindia.com/market-data/index-performances
Disclaimer
If you have any concerns, questions, or wish to point out any discrepancies in our content, please feel free to write to us at content@hdfcsec.com.
Please Note: The information shared is intended solely for informational purposes and does not make any investment recommendations