India VIX Falls 2.65% to 13.24 as Easing Volatility Supports Market Stability
Authored By HDFC SKY | Published at: Jul 1, 2026 04:37 PM IST
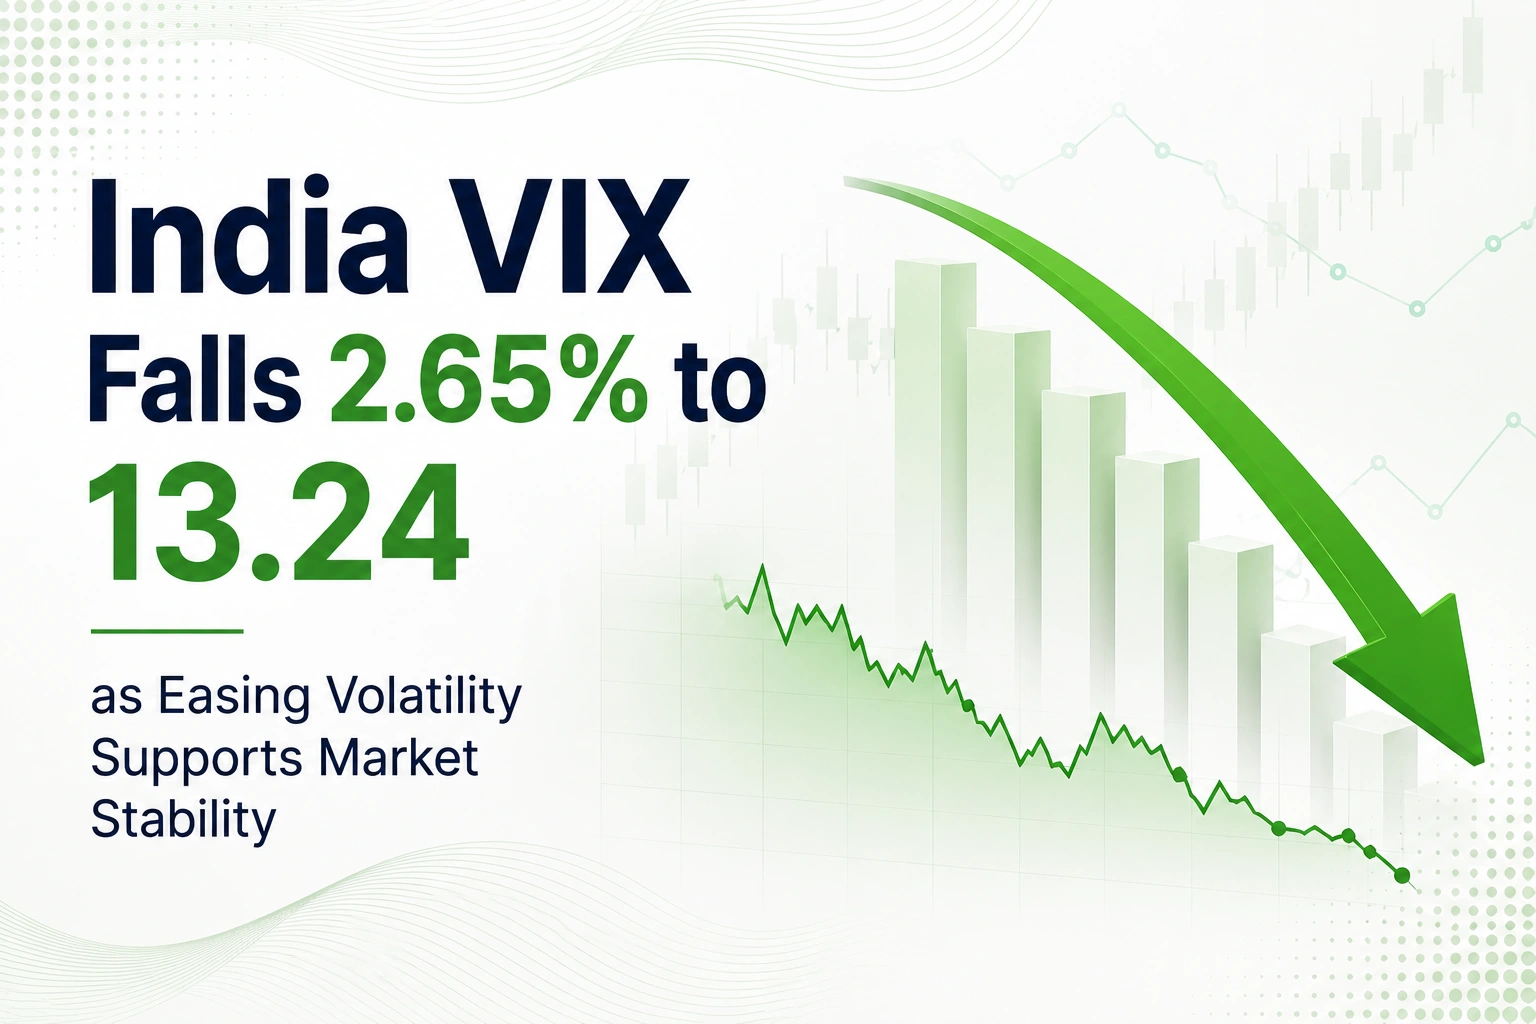
Mumbai, July 1: India VIX ended the trading session on Wednesday at 13.24, declining 0.36 points or 2.65% from the previous close of 13.60, indicating that market volatility moderated through the day.
The volatility gauge moved within a session range of 13.15 to 14.07, while broader equity markets recovered during trading. The decline followed the completion of the June futures and options (F&O) expiry and came despite global geopolitical developments that continued to remain under watch.
India VIX Closes at 13.24 After Trading Between 13.15 And 14.07
India VIX opened the session at 13.60, unchanged from the previous closing level, before witnessing intraday fluctuations. During the day, the index touched a high of 14.07 and a low of 13.15, before settling at 13.24, down 2.65%.
The movement reflected easing volatility during the trading session after an initially cautious opening. On a broader basis, India VIX continues to trade well below its 52-week high of 28.90, while remaining above its 52-week low of 8.72.
Despite Wednesday’s decline, the volatility gauge has delivered a year-to-date return of 39.66%, highlighting that volatility levels remain significantly higher than those seen at the beginning of the year.
Post-Expiry Cooling and Global Developments Reduced Intraday Volatility
The day’s movement in India VIX followed the successful rollover of the June derivatives expiry, which removed part of the short-term hedging premium that had built up ahead of contract settlement. Throughout the session, multiple market reports noted that volatility gradually eased as trading progressed.
While geopolitical developments continued to remain an important global risk factor, reports indicating reduced tensions during the day helped limit further increases in volatility.
Broader Market Recovery Coincides with Lower Volatility Levels
As trading progressed, broader equity markets strengthened, with reports noting that the easing in India VIX coincided with improved market performance during the session. Business Standard reported that the benchmark indices recovered sharply, with the Sensex advancing 494 points, while gains in the realty sector supported the broader market.
Throughout the day, successive market updates also reflected the gradual decline in the volatility index, with India VIX quoted around 13.45, 13.42 and 13.39 during different trading intervals before finally closing at 13.24. The decline suggested that intraday uncertainty reduced as the trading session advanced.
Morning Caution Gave Way to A Lower Closing Reading
Market coverage showed that India VIX experienced differing movements during the opening phase before settling into a downward trend. Early reports indicated a brief increase in volatility at the opening bell as traders assessed global developments and domestic market cues.
However, the index subsequently reversed direction during the session. Pre-market reports from several financial publications had identified India VIX as one of the key indicators to monitor following the June derivatives expiry. As the session unfolded, volatility gradually eased, resulting in a lower closing level compared with both the opening price and the previous day’s close.
Technical Levels Highlight Key Support and Resistance Zones
The latest technical data places India VIX in a Neutral trend category across daily observations. Based on the previous trading session’s price range, the Classic Pivot Point stands at 13.57, with resistance levels positioned at 13.99, 14.38, and 14.80, while support levels are placed at 13.18, 12.76, and 12.37.
Under the Fibonacci calculation, resistance levels are identified at 13.88, 14.07, and 14.38, while support levels stand at 13.26, 13.07, and 12.76. The Camarilla pivot levels place resistance at 13.67, 13.75, and 13.82, with support levels at 13.53, 13.45, and 13.38. Moving averages, technical indicators and moving average crossovers remained unavailable in the latest reading.
July Seasonality Shows Average Decline Across Seventeen Years
Historical seasonality data continues to indicate that July has generally been a weaker month for India VIX. Over the past 17 years, the index has recorded negative returns in 14 years during July. The strongest July gain was 7.39% in 2011, with an average positive movement of 4.47%. Conversely, the steepest July decline reached 24.22% in 2022, while the average negative movement stands at 11.39%.
Overall, the average July change for India VIX is -8.59%, highlighting the historical tendency for volatility to soften during the month, although annual movements have varied considerably.
India VIX concluded 1 July 2026 at 13.24, down 2.65%, after moving between 13.15 and 14.07 during the session. The day’s movement reflected lower volatility following the June derivatives expiry, alongside broader market recovery and continued monitoring of global developments. Historical July seasonality, technical levels and intraday data remain key reference points for tracking future movements in the volatility index.
Source
- https://www.nseindia.com/reports-indices-historical-vix
Disclaimer
If you have any concerns, questions, or wish to point out any discrepancies in our content, please feel free to write to us at content@hdfcsec.com.
Please Note: The information shared is intended solely for informational purposes and does not make any investment recommendations