Nifty 50
- Dr. Reddy's Labs₹1,311.1081.60 (6.64%)
- Shriram Finance₹822.05-42.95 (-4.97%)
- BSE₹3,365.30134.50 (4.16%)
- Tata Consumer ₹923.80-40.10 (-4.16%)
- Eternal₹325.057.65 (2.41%)
- Bajaj Finance₹914.60-14.35 (-1.54%)
- JSW Steel₹1,21125.50 (2.15%)
- HDFC Life Insurance ₹516.45-7.30 (-1.39%)
- Adani Ports₹1,736.2033.50 (1.97%)
- Asian Paints₹2,278-29.00 (-1.26%)
- Max Healthcare₹83116.00 (1.96%)
- Nestle₹1,162-13.00 (-1.11%)
- Kotak Mahindra Bank₹438.958.45 (1.96%)
- Infosys₹1,143.25-10.55 (-0.91%)
- Adani Enterprises₹2,506.5029.50 (1.19%)
- HDFC Bank₹687.20-5.60 (-0.81%)
- Coal India₹400.853.40 (0.86%)
- Tata Motors PV₹262.60-2.00 (-0.76%)
- Hindalco Industries₹8777.15 (0.82%)
- SBI Life Insurance ₹1,627.80-12.20 (-0.74%)

- Offerings
- Tools & Platforms
Tools & Calculators
- Open API
- Calculators
- SIP Calculator
- CAGR Calculator
- Compound Interest Calculator
- FD Calculator
- RD Calculator
- EPF Calculator
- Retirement Calculator
- HDFC SIP Calculator
- Mutual Fund Return Calculator
- Lumpsum Calculator
- Step Up SIP Calculator
- ETF SIP Calculator
- Brokerage Calculator
- Equity Margin Calculator
- SWP Calculator
- EMI Calculator
- MTF Calculator
- Margin Pledge Calculator
- Algo Strategy
- Markets
Stocks
F&O
Mutual Funds
- More
Market Mood Index in ‘Fear’ Zone
Authored By HDFC SKY | Last Modified: Oct 26, 2026 12:13 PM IST
Open Free Demat Account
Open Free Demat Account
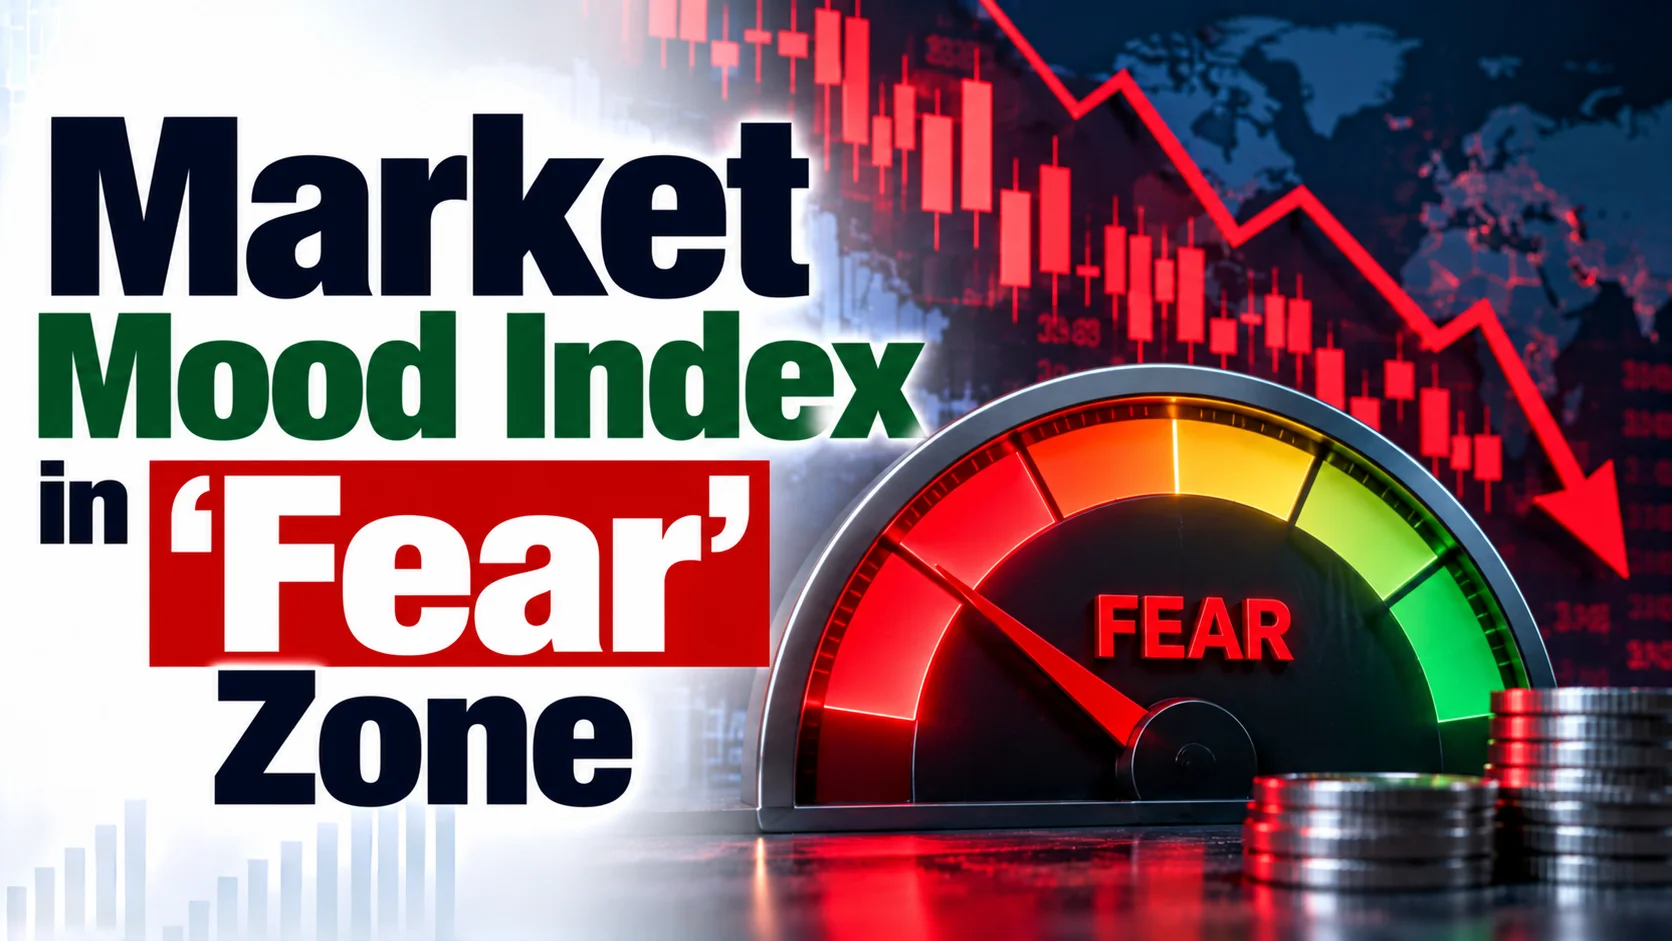
Mumbai, Oct 26: Tickertape’s Market Mood Index (MMI), which tracks investor sentiment in India, stood at 34.33 on Monday, placing it in the “fear” zone. Any reading between 30 and 50 falls in this category. It suggests that investors are fearful, but the action to be taken depends on how the index moves from here.
Indian equity benchmarks were still in the red at midday but had pared the sharp losses seen at the open. At 11:50 am, the Sensex was down 100.69 points, or 0.14%, at 73,023.14, while the Nifty 50 was down 37.25 points, or 0.16%, at 22,562.75 at 11:51 am. Both had opened much weaker, at 72,588.55 and 22,420, respectively.
The recovery follows a bruising week. On Friday, the Sensex closed at 73,123.83 and the Nifty at 22,600, a fourth straight session of losses that snapped a two-week winning streak. Over the week, the Sensex and Nifty declined 2.2% and 2.4%, respectively.
Crude oil remains the main pressure point. Brent crude was at $114.88 a barrel in morning trade despite a 1.58% fall, while WTI slipped 1.87% to $101.34. Murban crude bucked the trend, rising 3.16% to $118, and natural gas fell 3.94% to $2.536. For India, which depends on imported crude, prices at these levels raise concerns about the import bill, inflation and corporate margins.
The situation in Iran is the other big worry. According to a memo seen by Reuters, US Director of National Intelligence Jay Clayton warned on October 23 that Tehran has substantially increased efforts to target US personnel, and that lethal plots against American citizens have reached advanced stages in the Middle East and other countries. Washington has scaled back staffing at its Saudi Arabia mission after intensified Houthi attacks.
Attacks on commercial shipping in the Strait of Hormuz have also risen sharply, adding to global supply worries. The Iran war is a week away from entering its ninth month and has weighed on US President Donald Trump’s approval ratings ahead of the November 3 midterm elections.
With the US Federal Reserve’s policy decision due on Wednesday, Brent near $115 and fresh threats in the Middle East, the direction of the index in the coming sessions will matter more than a single reading.

How the MMI Is Measured
Tickertape builds the MMI from six factors: foreign institutional investor (FII) activity, volatility and skew, momentum, market breadth, price strength and demand for gold. Each factor’s current value is compared with its 45-trading-day rolling average and standard deviation. The readings are normalised to a scale of 0 to 100, with equal weight for all six factors. A score below 30 falls in the extreme fear zone, 30 to 50 in the fear zone, and higher readings move through greed toward extreme greed.
Source
- Tickertape’s Market Mood Index
Disclaimer
The information shared here is intended solely for informational and educational purposes and does not constitute investment recommendations. While we practice strict due diligence in curating daily market data, readers must perform independent research before trading. To flag any real-time data discrepancies or content concerns, please write to us at content@hdfcsec.com.
 Join Us
 Add as preferred source on Google


More Markets News








Open Free Demat Account
Open Free Demat Account












Invest Anytime, Anywhere


By signing up I certify terms, conditions & privacy policy