Nifty 50
- Dr. Reddy's Labs₹1,229.4032.40 (2.71%)
- Apollo Hospitals₹7,775-252.50 (-3.15%)
- Bajaj Auto₹10,034256.00 (2.62%)
- ITC₹257.90-8.10 (-3.05%)
- Tata Motors PV₹284.454.55 (1.63%)
- Tech Mahindra₹1,471-43.10 (-2.85%)
- Bharat Electronics₹373.905.75 (1.56%)
- L&T₹3,627.50-75.80 (-2.05%)
- BSE₹3,330.2043.00 (1.31%)
- Max Healthcare₹865.95-17.85 (-2.02%)
- Cipla₹1,317.4016.40 (1.26%)
- Hindalco Industries₹882.50-17.85 (-1.98%)
- Eicher Motors₹7,11969.00 (0.98%)
- Hindustan Unilever₹1,820.70-36.00 (-1.94%)
- Mahindra & Mahindra₹2,81316.80 (0.60%)
- SBI₹941-18.10 (-1.89%)
- Kotak Mahindra Bank₹443.402.40 (0.54%)
- Coal India₹404.80-6.75 (-1.64%)
- HCL Technologies₹1,2236.30 (0.52%)
- Bharti Airtel₹1,778.70-26.40 (-1.46%)

- Offerings
- Tools & Platforms
Tools & Calculators
- Open API
- Calculators
- SIP Calculator
- CAGR Calculator
- Compound Interest Calculator
- FD Calculator
- RD Calculator
- EPF Calculator
- Retirement Calculator
- HDFC SIP Calculator
- Mutual Fund Return Calculator
- Lumpsum Calculator
- Step Up SIP Calculator
- ETF SIP Calculator
- Brokerage Calculator
- Equity Margin Calculator
- SWP Calculator
- EMI Calculator
- MTF Calculator
- Margin Pledge Calculator
- Algo Strategy
- Markets
Stocks
F&O
Mutual Funds
- More
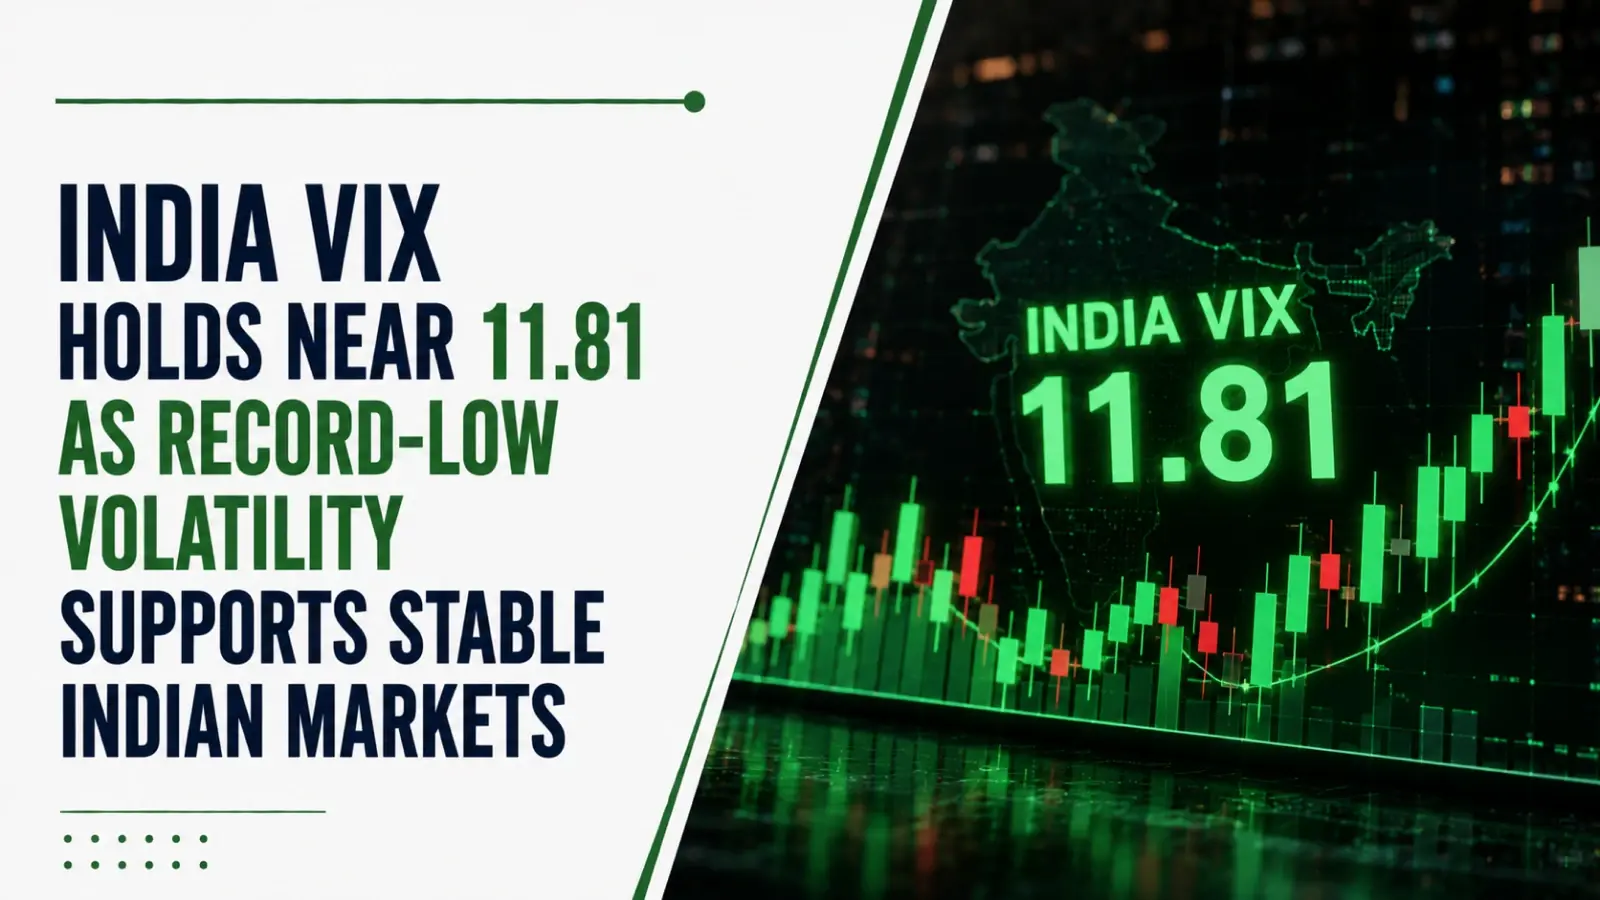
India VIX Holds Near 11.81 as Record-Low Volatility Supports Stable Indian Markets
Authored By HDFC SKY | Last Modified: Jul 7, 2026 11:17 AM IST
Open Free Demat Account
Open Free Demat Account
Mumbai, July 7: India VIX remained near a multi-month low during the opening session on Tuesday, reflecting subdued market volatility as traders continued to price in limited near-term uncertainty. As of 10:13 IST, the volatility index stood at 11.81, marginally lower by 0.01 points (-0.08%), after opening at 11.81.
The index touched an intraday high of 11.93 and a low of 11.05, while remaining significantly below its 52-week high of 28.90 and comfortably above its 52-week low of 8.72. The latest reading comes after the index has declined steadily over recent sessions, reinforcing the calm trading environment witnessed across Indian equities.
India VIX At 11.81 Keeps Volatility Below Key 15 Mark
The India VIX continued to trade below the widely tracked 15-point threshold, remaining in the 11.80-11.90 range during the opening session. The latest reading also marks the first time since February 2026 that the index has consistently traded below 12, highlighting a sharp moderation in expected market volatility.
Also Read: What is India VIX Index?
On a year-to-date basis, the volatility gauge has still gained 24.58%, although it has fallen sharply from its 52-week peak of 28.90 recorded during heightened geopolitical uncertainty earlier this year. Technical indicators currently assign a ‘Neutral’ trend rating, while pivot levels place the day’s primary pivot at 11.96, with immediate resistance at 12.21 and support at 11.56.
Falling Volatility Follows Strong Equity Rally And Stable Global Conditions
The subdued India VIX reading comes after Indian benchmark indices extended their gains in the previous trading session. On 6 July, the Nifty 50 advanced 0.66% or 159.50 points to close at 24,430.35, while the Sensex gained 0.67%, or 521.16 points, to finish at a record closing high of 78,285.07, marking its first-ever close above the 78,000 level.
The decline in market volatility has coincided with easing geopolitical concerns, stable crude oil prices around $72 per barrel, improving global market sentiment, steady domestic macroeconomic conditions and continued buying by Foreign Institutional Investors (FIIs), who purchased equities worth ₹1,355.33 crore during the latest trading session.
These developments have collectively contributed to reduced demand for downside protection in the options market, keeping implied volatility subdued.
Options Market Reflects Lower Hedging Costs At Current Levels
With India VIX hovering near 11.82, the options market is currently pricing in an implied 30-day volatility of around 3.4% for the Nifty 50. Based on prevailing index levels near 24,385, this corresponds to an expected movement of approximately ±833 points over the coming month.
The lower volatility environment has also reduced the cost of purchasing protective put options, making portfolio hedging comparatively less expensive than during periods of elevated uncertainty.
Market activity has additionally been characterised by continued call option writing and a relatively lower demand for defensive positions, reflecting the prevailing low-volatility backdrop.
Technical Levels Highlight Support and Resistance for Traders
India VIX continues to trade within a well-defined technical range during the current session. According to daily pivot calculations, the Classic Pivot Point stands at 11.96, with resistance levels placed at 12.21, 12.61, and 12.86, while support levels are identified at 11.56, 11.31, and 10.91.
Under the Fibonacci Pivot model, immediate resistance is seen at 12.20, followed by 12.36 and 12.61, whereas support levels are placed at 11.71, 11.55, and 11.31. Meanwhile, the Camarilla Pivot framework identifies resistance between 11.88 and 12.00, with support ranging from 11.76 to 11.64. These reference levels are derived from the previous trading session’s price range and are widely monitored during intraday trading.
July Seasonality Continues To Favour Softer India VIX Readings
Historical seasonality data also aligns with the current moderation in volatility. Over the past 18 years, India VIX has delivered negative returns during July in 15 instances, making it one of the weaker months historically for the volatility index. The average monthly decline for July stands at 8.85%, with the largest recorded fall of 24.22% occurring in 2022. Conversely, the strongest positive July movement was 7.39%, recorded in 2011, while the average positive July gain stands at 4.47%.
The recent decline also extends a broader trend witnessed through early July. After trading at 13.24 on 1 July, the index eased to 12.29 on 2 July, fell to an intraday low of 11.65 on 3 July, and has continued to remain around the 11.80-11.90 range during the opening session on 7 July.
Weekly Expiry and Earnings Remain Immediate Market Focus
Tuesday’s session also coincides with the weekly Nifty options expiry, with market participants closely monitoring activity around the 24,400-24,500 strike prices, where open interest remains concentrated. The low India VIX indicates that option premiums continue to remain relatively inexpensive during the current expiry cycle.
Attention is also gradually shifting towards the upcoming first-quarter FY27 earnings season, beginning with TCS on 9 July, while broader market participants continue monitoring developments in crude oil prices, global central bank commentary, monsoon progress and foreign institutional investment flows for further market direction.
India VIX remained at 11.81 during the opening session on 7 July 2026, extending its low-volatility phase amid stable domestic and global market conditions. Alongside the weekly derivatives expiry and the approaching corporate earnings season, the volatility index continues to serve as an important gauge of expected market fluctuations over the coming weeks.
Source
Disclaimer
If you have any concerns, questions, or wish to point out any discrepancies in our content, please feel free to write to us at content@hdfcsec.com.
Please Note: The information shared is intended solely for informational purposes and does not make any investment recommendations
Disclaimer
At HDFC SKY*, we take utmost care and due diligence in curating and presenting news and market-related content. However, inadvertent errors or omissions may occasionally occur.
If you have any concerns, questions, or wish to point out any discrepancies in our content, please feel free to write to us at content@hdfcsec.com.
Please Note: The information shared is intended solely for informational purposes and does not make any investment recommendations.
HDFC SKY from HDFC Securities, one of most trusted trading platforms in India, has been recognized with the *Next-Gen Digi Content Awards 2025-26.
 Join Us
 Add as preferred source on Google


More Business News










Open Free Demat Account
Open Free Demat Account












Invest Anytime, Anywhere


By signing up I certify terms, conditions & privacy policy