Nifty 50
- Adani Ports₹1,872110.70 (6.29%)
- Trent₹2,861.70-52.20 (-1.79%)
- Adani Enterprises₹2,607.90128.10 (5.17%)
- Maruti Suzuki₹11,426-153.00 (-1.32%)
- Kotak Mahindra Bank₹45919.00 (4.32%)
- Bajaj Auto₹10,383-102.00 (-0.97%)
- Eternal₹337.8511.85 (3.63%)
- SBI Life Insurance ₹1,652-14.70 (-0.88%)
- Power Grid Corp₹2608.60 (3.42%)
- Eicher Motors₹7,238-62.00 (-0.85%)
- Bajaj Finance₹938.9021.65 (2.36%)
- Hindalco Industries₹886.30-7.45 (-0.83%)
- Hindustan Unilever₹1,858.2042.40 (2.34%)
- Cipla₹1,358-7.60 (-0.56%)
- NTPC₹310.506.75 (2.22%)
- Tech Mahindra₹1,769.60-7.00 (-0.39%)
- Titan Company₹4,43496.10 (2.22%)
- InterGlobe Aviation₹4,675-15.00 (-0.32%)
- ITC₹2655.50 (2.12%)
- HDFC Bank₹683.30-2.00 (-0.29%)

- Offerings
- Tools & Platforms
Tools & Calculators
- Open API
- Calculators
- SIP Calculator
- CAGR Calculator
- Compound Interest Calculator
- FD Calculator
- RD Calculator
- EPF Calculator
- Retirement Calculator
- HDFC SIP Calculator
- Mutual Fund Return Calculator
- Lumpsum Calculator
- Step Up SIP Calculator
- ETF SIP Calculator
- Brokerage Calculator
- Equity Margin Calculator
- SWP Calculator
- EMI Calculator
- MTF Calculator
- Margin Pledge Calculator
- Algo Strategy
- Markets
Stocks
F&O
Mutual Funds
- More
- Your 10-Minute Pre-Market F&O Routine at a Glance
- Minutes 1–2: Understand the Market Context
- Minutes 3-5: Review Futures Activity and Open Interest
- Minutes 6-7: Shortlist Option Contracts
- Your output after nine minutes: one possible strategy, or a clear decision to wait.
- How to Use HDFC SKY Nudges During the Routine
- Conclusion
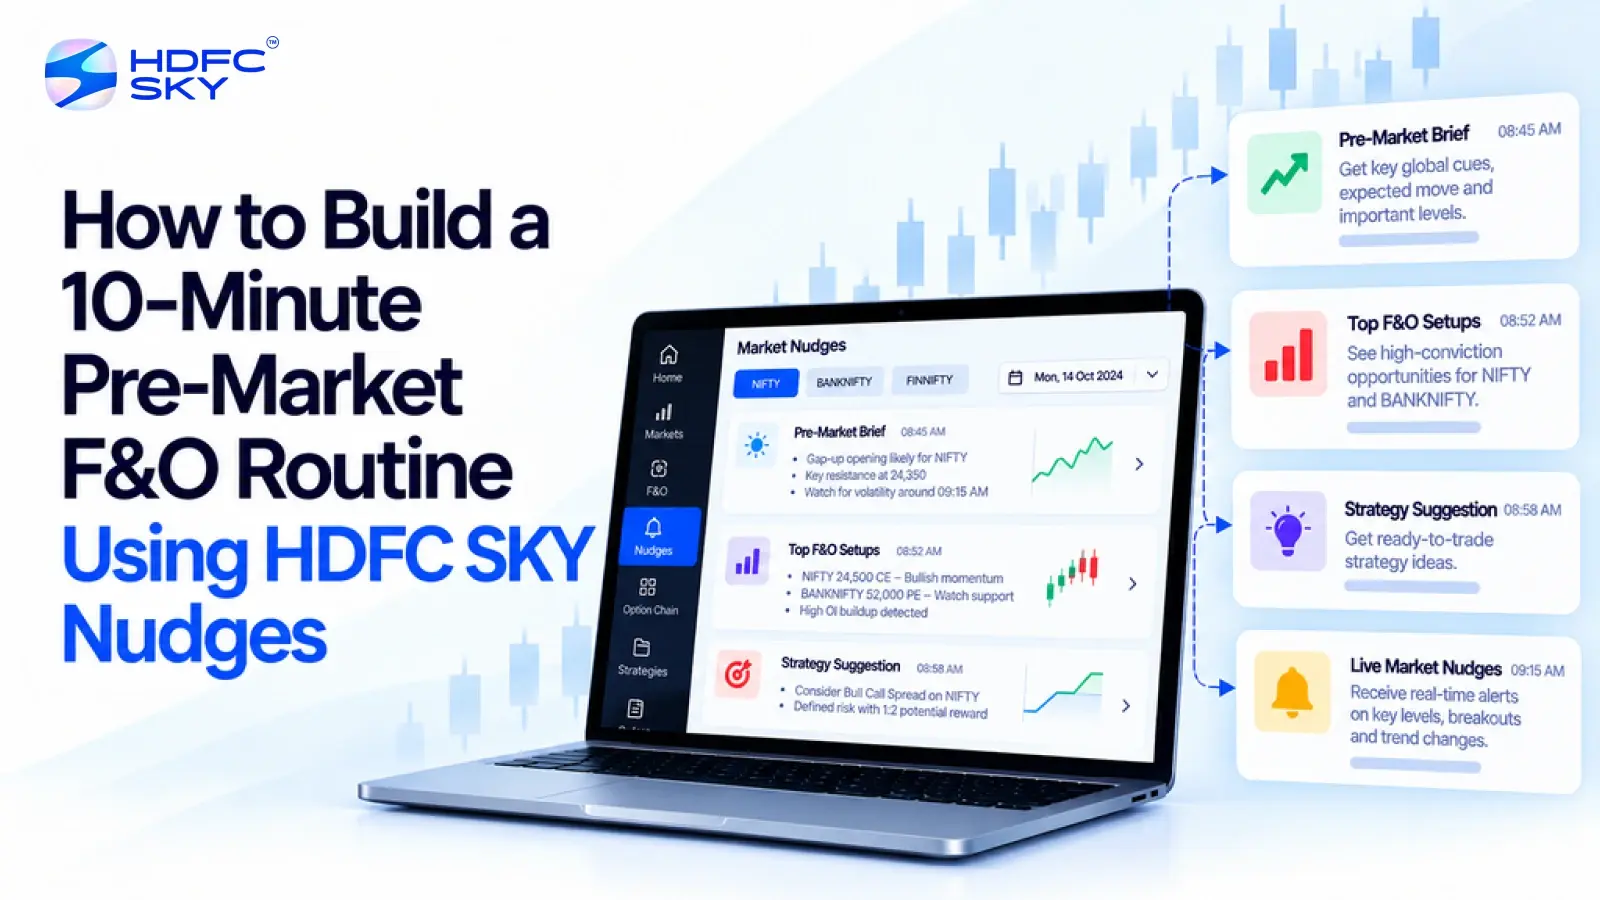
How to Build a 10-Minute Pre-Market F&O Routine Using HDFC SKY Nudges
By HDFC SKY | Published at: Oct 29, 2026 04:33 PM IST
Open Free Demat Account
Open Free Demat Account
Futures and Options (F&O) trading requires preparation before the market opens. A short routine can help you review market conditions, identify important levels, compare option contracts, and check risk before taking a position. HDFC SKY brings these tasks together through its F&O tools, including the F&O Dashboard, Open Interest Analysis, Advanced Option Chain, Forecast View, and Payoff Analyzer. This guide explains how to use these features in a focused 10-minute routine.
Your 10-Minute Pre-Market F&O Routine at a Glance
Use the following schedule to give every task a clear time limit:
| Time | Task | HDFC SKY Tool |
| 9:00–9:02 | Review market context | Market information and alerts |
| 9:02–9:05 | Check futures activity and positioning | F&O Dashboard and Open Interest Analysis |
| 9:05–9:07 | Shortlist option contracts | Advanced Option Chain |
| 9:07–9:09 | Explore a possible strategy | Forecast View and strategy tools |
| 9:09–9:10 | Check risk and payoff | Payoff Analyzer |
This routine supports preparation. It does not mean you must place a trade within 10 minutes. The NSE pre-open session applies to eligible securities and futures segments, but options do not follow the same pre-open process. Treat this period as a research window rather than a guaranteed trading opportunity.
Minutes 1–2: Understand the Market Context
Start with the broader market picture. Avoid opening the option chain before you know what may influence the underlying asset.
Use these two checks during the first two minutes.
1. Check important market developments
Review the information that could affect the index or stock you plan to trade. Focus on developments such as:
- Global market movements.
- Major economic announcements.
- Central bank decisions.
- Crude oil and currency movements.
- Company-specific announcements.
- Significant overnight price changes.
Do not try to read every headline. Select only the information that can influence your chosen underlying.
2. Set one market question
Turn the information into one clear question. For example:
- Will the index open near the previous close?
- Could overnight news create a gap?
- Does the market show a directional bias or mixed signals?
- Which sector may influence the index today?
This question will guide the rest of your routine.
Your output after two minutes: one underlying to study and one market question to test.
Minutes 3-5: Review Futures Activity and Open Interest
Now move from general news to market positioning. This step helps you understand where traders have placed interest and how the futures market behaves.
1. Select the underlying asset
Choose the index or stock that matches your market question. Do not scan several unrelated assets during this short window.
Check:
- The current price.
- The previous close.
- The futures price.
- The expiry you want to study.
- The recent price movement.
Keep the focus on one contract or one underlying at a time.
2. Review futures information
Use the HDFC SKY F&O Dashboard to review the available futures data. Pay attention to the relationship between the underlying price and the futures price.
Also check:
- Trading volume.
- Price change.
- Expiry details.
- Recent movement in the futures contract.
- Any visible difference between spot and futures prices.
These details provide context. They do not confirm whether the market will rise or fall.
3. Study open interest changes
Use Open Interest Analysis to examine changes in open positions. Compare price movement with open interest instead of viewing either figure alone.
For example:
- Rising price with rising open interest may show increased participation in the move.
- Falling price with rising open interest may indicate stronger participation on the downside.
- Rising price with falling open interest may reflect position closures.
- Falling price with falling open interest may also reflect position closures.
These combinations offer clues, not fixed outcomes. Use them alongside price action and other market information.
Mark only the levels that matter for your next decision. Avoid drawing too many support and resistance zones.
Your output after five minutes: one underlying, one expiry, and a small set of price levels to monitor.
Also Read: Automated F&O Market Nudges on HDFC SKY: Daily Signals Delivered to You
Minutes 6-7: Shortlist Option Contracts
After reviewing futures activity, use the Advanced Option Chain to compare actual option contracts. This stage focuses on contract selection rather than general market direction.
1. Choose the expiry
Select the expiry that matches your planned holding period and risk tolerance.
Review:
- Weekly or monthly expiry.
- Days remaining until expiry.
- Liquidity around the selected expiry.
- The effect of time decay.
Avoid selecting a contract only because it has a low premium. A cheaper option may also carry higher time-decay risk or lower liquidity.
2. Compare relevant Call and Put strikes
Use the option chain to compare nearby strikes. Review the information available for each contract, such as:
- Bid and ask prices.
- Trading volume.
- Open interest.
- Implied volatility.
- Premium.
- Greeks, where available.
Focus on strikes near the price levels identified during the futures review. This keeps the selection process narrow and avoids unnecessary scanning.
3. Shortlist the contracts
Choose a small number of contracts for further review. For example, you may shortlist:
- One Call option.
- One Put option.
- One alternative strike for comparison.
Do not treat the highest volume or open interest as an automatic trading signal. Use these figures to assess liquidity and market participation.
Your output after seven minutes: a short list of option contracts that fit the selected underlying and expiry.
Minutes 8-9: Explore a Possible F&O Strategy
Use the next two minutes to translate your market view into a possible strategy. At this stage, focus on structure and suitability. Leave detailed payoff analysis for the final minute.
1. State your market view clearly
Choose the view that best describes your current assessment:
- Bullish.
- Bearish.
- Range-bound.
- Unclear.
If the evidence does not support a clear view, keep the outcome as “unclear”. You do not need to force a directional opinion.
2. Explore HDFC SKY’s strategy tools
Use HDFC SKY’s Forecast View and related strategy features to examine possible approaches. Depending on your view, you may explore:
- A Call-based strategy for a bullish view.
- A Put-based strategy for a bearish view.
- A spread for a defined structure.
- A range-based strategy when you expect limited movement.
Use these tools to compare structures. Do not assume that a suggested strategy suits your account, experience, or market conditions.
3. Match the strategy with your shortlisted contracts
Check whether the proposed strategy uses the contracts you shortlisted from the option chain.
Confirm:
- The correct underlying.
- The selected expiry.
- The relevant strike prices.
- The number of legs.
- Whether the strategy matches your market view.
Do not add extra legs simply to make the strategy look more advanced. Use only the structure you can understand and monitor.
Your output after nine minutes: one possible strategy, or a clear decision to wait.
Minute 10: Check the Strategy with Payoff Analyzer
Use the final minute to understand what the proposed trade could produce across different price outcomes. This step separates a market view from a complete trading decision.
1. Review the payoff
Open the Payoff Analyzer and examine the strategy’s possible outcomes.
Check:
- Maximum possible profit.
- Maximum possible loss.
- Breakeven levels.
- Profit and loss at different underlying prices.
- The effect of each option leg.
Do not focus only on the maximum profit. A strategy may offer a large profit potential but also carry a loss that does not suit your risk limit.
2. Check the strategy-level Greeks
Review the available Greeks to understand how the position may respond to market changes.
Pay attention to:
- Delta for directional sensitivity.
- Theta for time decay.
- Vega for implied volatility changes.
- Other available measures that affect the position.
You do not need to calculate every Greek manually. Use the displayed information to understand the main risks before proceeding.
3. Make a final preparation decision
Choose one of three outcomes:
- Prepare the trade for further review.
- Wait for clearer market information.
- Skip the trade.
A no-trade decision is a valid result. The routine should improve decision quality, not create pressure to trade every morning.
How to Use HDFC SKY Nudges During the Routine
Use nudges as prompts that direct your attention to relevant information. Do not treat them as automatic buy or sell instructions.
Follow these principles:
- Use nudges to begin research: Open the relevant chart, dashboard, or option chain when an alert highlights a market development.
- Confirm the underlying: Check whether the alert relates to the index or stock you plan to trade.
- Review the supporting data: Compare the alert with price movement, futures information, volume, and open interest.
- Check the contract: Review expiry, strike, premium, liquidity, and Greeks before considering an option.
- Use Payoff Analyzer: Understand the possible outcome of the complete strategy rather than relying on the alert alone.
- Accept a no-trade outcome: Ignore a nudge when the supporting information does not match your plan.
A nudge can help you decide what to examine next. It cannot remove market risk or guarantee a result.
Conclusion
A 10-minute pre-market F&O routine helps you replace rushed decisions with a repeatable process. Use HDFC SKY Nudges to identify what needs attention, then confirm each idea through the F&O Dashboard, Open Interest Analysis, Advanced Option Chain, Forecast View, and Payoff Analyzer. Finish with a clear decision, even when that decision means waiting.



Open Free Demat Account
Open Free Demat Account
Popular Posts
- 10 Interesting Facts About NSE You Probably Didn’t KnowLast Updated: Sep 30, 2026
- 8-4-3 Rule of SIP - How Does That Work?Last Updated: Jul 30, 2025
- Let's view more exciting Post!
Popular Post from Derivatives
- Manual F&O Trading vs Algo Strategies on HDFC SKY: Which Suits Your Trading Style?Last Updated: Oct 29, 2026
- Curated Algo Strategies on HDFC SKY: How to Read Strategy Performance Before You SubscribeLast Updated: Oct 29, 2026
- How to Deploy Your First Algo Strategy on HDFC SKY via AlgoBulls: A Step-by-Step GuideLast Updated: Oct 29, 2026
- Options Tab Walkthrough on HDFC SKY: IV, OI, and Max Pain at a GlanceLast Updated: Oct 29, 2026
- Futures Tab Walkthrough on HDFC SKY: Where to Find Basis, Rollover, and OI DataLast Updated: Oct 29, 2026
- Let's view more exciting Post!
Popular Post from Blogs
- “Bounce Back” Theme Gains Traction in 2026Last Updated: Apr 8, 2026
- 5 Takeaways for Tax Payers from the Budget 2025Last Updated: Jan 29, 2026
- Let’s view more exciting Posts


Invest Anytime, Anywhere


By signing up I certify terms, conditions & privacy policy