Rural India Shifting Economic Foundations
Authored By Ankur Chandra | Published at: Jul 1, 2025 01:05 PM IST

In the past few quarters rural India has been driving consumption growth in Indian economy. Consumption growth in urban India remained on the softer side due to persistent inflation. HDFC Securities Institutional Equities (HSIE) team has done a bottom-up analysis of 250 rural districts across 8 key Indian states. These districts and states account for approximately 72% of the rural GDP of India.
The key findings of this extensive analysis can be summarized in two conclusions. One, Rural India is transitioning from an agri-centric economy to a services-led economy. Two, 112 rural districts comprising a population of 291 million have already crossed the threshold of annual per capita income of $2,000. This pool of individuals having per capita income of more than $2000 is expected to drive sustained demand for discretionary products and services.
The analysis concludes that states that have a strong rural economy are Maharashtra, Tamil Nadu, Kerala and Andhra Pradesh. Some key consumer-facing companies, that are part of HDFC Securities Institutional Equity coverage universe and have a strong presence in the rural parts of these states are Avenue Supermart, TVS, Ashok Leyland, Federal Bank, City Union Bank and Medplus.
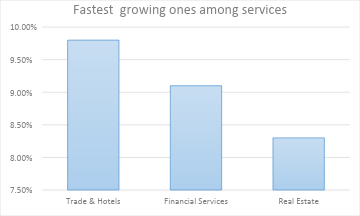
Services emerge as the fastest growing sector
Another key takeaway from this analysis is that Services are fastest growing sector in the rural districts covered in the period , FY 22-FY 25. Compounded Annual Growth Rate (CAGR) of services currently stands at an average of 8.8% in these districts. Among services, the fastest growing ones are trade & hotels (CAGR of 9.8%); financial services (9.1%); and real estate (8.3%).
Growth of industry in these rural districts currently stands at a stable 7.1% CAGR. Strong performance is in mining (CAGR of 13.5%) and construction (8.7%). Manufacturing has lagged behind at a CAGR of 5%.
Agricultural growth in these rural districts seems to be a sluggish, with a CAGR currently of 3.9%. Weak crop growth at 2.8% is the main cause of this. However, aquaculture at 7.4% and livestock at 5% have shown stronger growth.
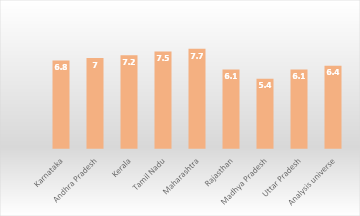
State level performance during FY22-FY25
Maharashtra, Tamil Nadu, Kerala and Andhra Pradesh are driving the growth in rural districts, which is supported by a burgeoning services sector. Per capita income in rural districts in Uttar Pradesh is lower than its peers but growth is strong.
Both Karnataka and Madhya Pradesh reported poor growth in their agricultural and industry sectors in this period.
Wide disparity still there
Wide disparity has been found in district-wise per capita income. Certain rural districts like Dakshina Kannada (Karnataka) and Namakkal (Tamil Nadu) have annual rural per capita income of more than $5000. On the other hand, many rural districts in Uttar Pradesh have per capita income of less than $1,000.
Top-performing rural districts show sector specialization. For example, those in Andhra Pradesh show specialization in aquaculture. Livestock specialization is seen in Tamil Nadu. And mining specialization in top performing rural districts of Uttar Pradesh.
Rural score
| States | Nominal rural per capita income FY25 ($) | Real rural GSDP CAGR (FY22-FY25) (%) | Nominal contribution of sectors to rural GSDP FY25 | Sector scores | Weighted average rural score | ||||
| Agri | Industry | Services | Agri | Industry | Services | ||||
| Karnataka | 3,086 | 6.2 | 20% | 24% | 56% | 0.0 | 5.8 | 8.2 | 6.8 |
| Andhra Pradesh | 2,984 | 6.5 | 36% | 22% | 42% | 3.9 | 6.0 | 8.6 | 7.0 |
| Kerala | 2,939 | 6.7 | 13% | 21% | 66% | 3.5 | 3.9 | 8.2 | 7.2 |
| Tamil Nadu | 2,769 | 7.6 | 20% | 30% | 50% | 2.1 | 7.8 | 9.1 | 7.5 |
| Maharashtra | 2,698 | 7.7 | 20% | 22% | 58% | 5.2 | 5.6 | 9.1 | 7.7 |
| Rajasthan | 2,047 | 6.6 | 30% | 27% | 43% | 4.0 | 7.6 | 7.3 | 6.1 |
| Madhya Pradesh | 1,680 | 6.2 | 48% | 19% | 33% | 4.2 | 5.8 | 8.5 | 5.4 |
| Uttar Pradesh | 979 | 8.1 | 32% | 21% | 47% | 5.9 | 10.0 | 7.6 | 6.1 |
| Analysis universe | 1,972 | 7.1 | 28% | 23% | 49% | 4.0 | 6.9 | 8.3 | 6.4 |
Sources: DES of states, Census 2011, MOSPI, HSIE Research
content@hdfcsec.com.
Disclaimer : This content is only for informational purpose. It does not make any recommendation to act or invest. To get any errors corrected, write to
Source: HDFC Securities Institutional Equities. To see the detailed report click on:https://www.hdfcsec.com/hsl.docs/Rural%20India%20-%20Jun25%20-%20HSIE-202506301322308048209.pdf?t=3062025133529760