Nifty 50
- Tata Consumer ₹1,00063.50 (6.78%)
- Asian Paints₹2,277-45.00 (-1.94%)
- Bharti Airtel₹1,978.8061.30 (3.20%)
- Coal India₹398-7.00 (-1.73%)
- Bajaj Auto₹10,390319.00 (3.17%)
- Grasim Industries₹2,900.80-49.20 (-1.67%)
- BSE₹3,441.1082.10 (2.44%)
- SBI₹945.10-15.70 (-1.63%)
- Trent₹2,820.6066.60 (2.42%)
- TCS₹2,496.90-38.10 (-1.50%)
- Maruti Suzuki₹11,450230.00 (2.05%)
- Adani Enterprises₹2,474.10-33.90 (-1.35%)
- Power Grid Corp₹251.754.75 (1.92%)
- Axis Bank₹1,205.70-14.30 (-1.17%)
- Eternal₹3315.45 (1.67%)
- ICICI Bank₹1,386.90-16.10 (-1.15%)
- Max Healthcare₹847.9012.90 (1.54%)
- HDFC Bank₹680.20-7.85 (-1.14%)
- Bharat Electronics₹368.155.15 (1.42%)
- HDFC Life Insurance ₹513.60-5.40 (-1.04%)

- Offerings
- Tools & Platforms
Tools & Calculators
- Open API
- Calculators
- SIP Calculator
- CAGR Calculator
- Compound Interest Calculator
- FD Calculator
- RD Calculator
- EPF Calculator
- Retirement Calculator
- HDFC SIP Calculator
- Mutual Fund Return Calculator
- Lumpsum Calculator
- Step Up SIP Calculator
- ETF SIP Calculator
- Brokerage Calculator
- Equity Margin Calculator
- SWP Calculator
- EMI Calculator
- MTF Calculator
- Margin Pledge Calculator
- Algo Strategy
- Markets
Stocks
F&O
Mutual Funds
- More
HSIE Institutional Report: Hitachi Energy Feb, 06 2026
Authored By Prime Research | Last Modified: Feb 6, 2026 11:09 AM IST
Open Free Demat Account
Open Free Demat Account

Robust Performance
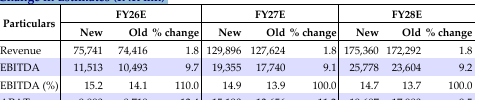
Hitachi Energy India (HEI) reported a revenue/EBITDA/APAT beat of 7/11/15%, respectively. The EBITDA margin was a positive surprise at 16.6%, driven by operating leverage and cost optimization. HEI’s annualized below-EBITDA line costs are ~1,000bps higher than peers, primarily driven by ~450bps higher royalty and other expenses respectively. Significant volume ramp-up has helped compress the below EBITDA line cost and aided early mid-teen EBITDA margin. With the ramp-up of the HVDC order book, we expect higher core EBITDA margins to get diluted by lower HVDC margins, though absolute EBITDA will grow. This is still 3-4 quarters away and contingent on HVDC revenue coming in. HEI expects annual tendering of 2-3 HVDC projects to sustain the growth required for transmission system. HEI has ~INR 298.7bn of OB as of Dec’25, of which ~INR 100bn are base orders. We continue to expect HVDC orders to be growth accretive and margin dilutive and this has been incorporated into our estimates. HEI is undertaking INR 20bn of capex to expand capacities (over the next five years, INR 4bn/year) in India to cater to both local and global demand. With volume growth, we expect the positive margin trajectory to be maintained. We have recalibrated our EPS estimates higher to factor in better EBITDA as operating leverage plays out. We maintain ADD, with an increased TP of INR 22,892/sh (55x Dec-27E EPS vs. 60x earlier to factor in higher share of HVDC projects business in the mix).
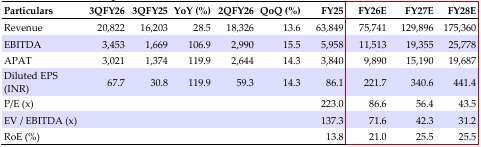
Hitachi Energy Q3FY26 Financial Highlights
HEI reported revenue of INR 20.8bn (+28.5/+13.6% YoY/QoQ, a beat of 6.8%). EBITDA stood at INR 3.5bn (+107/+16% YoY/QoQ, a beat by 11%), with EBITDA margin at 16.6% (+628/+27bps YoY/QoQ), a beat vs. our estimate of 15.9%. APAT came in at INR 3bn (+120/+14% YoY/QoQ), a beat by 15%), aided by higher business volume, higher other income, and lower other expenses.
Strong Base Order Inflow
In Q3FY26, HEI received orders worth INR 24.5bn (+18/12% YoY/QoQ), comprising Industries, Renewables, Transport, and Energy/power. Exports accounted for 30% of OI majorly from utilities and data centers. Segment-wise, Q3FY26 order mix comprises products/projects/services at 79/17/4%, respectively. Sector-wise, OB mix across utilities/industries/transport and infra stands at 47/43/10%, respectively. From a channel standpoint, direct end user, EPC, OEM, and distributor contributions stood at 68/15/14/3%, respectively.
Hitachi Energy Financial Summary (INR mn)
Change in Estimates (INR mn)
Source: HSIE Research (HSIE Results Daily – 06 Feb 26 – HSIE-202602060713371815208.pdf)
Disclaimer
If you have any concerns, questions, or wish to point out any discrepancies in our content, please feel free to write to us at content@hdfcsec.com.
Disclaimer
The information shared here is intended solely for informational and educational purposes and does not constitute investment recommendations. While we practice strict due diligence in curating daily market data, readers must perform independent research before trading. To flag any real-time data discrepancies or content concerns, please write to us at content@hdfcsec.com.
 Join Us
 Add as preferred source on Google


More Markets News










Open Free Demat Account
Open Free Demat Account











Invest Anytime, Anywhere


By signing up I certify terms, conditions & privacy policy