HSIE Institutional Report: Medplus Health Services
Authored By Prime Research | Last Modified: Feb 3, 2026 07:20 PM IST
Medplus Health Services Focus on Growth, Private Label, and Steady Margin
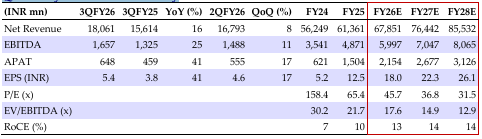
EBITDA^ grew 25% YoY, led by 16% sales growth (pharmacy +16% YoY, diagnostics +19% YoY) and an expanded gross margin (+113 bps YoY; private label share to 22.2%), which offset higher costs. OPM* came in at 5.4% (+24 bps YoY), with pharmacy margin at 5.2% (+13 bps YoY) and diagnostic margin at 15.5%. Medplus retains its guidance to add 600 stores in FY26E (400 added in 9M) and FY27E. It expects (1) overall private label sales continue to improve (gradual for pharma and faster for non-pharma) over the next few quarters (on GMV every 1% increase, implying 0.5% on net sales), given stickiness in the business (~90% repeat purchase due to favourable discounts), aiding steady GM expansion; (2) pick-up in growth from mature stores largely led by low base, better product availability (operationalization of new warehouses) and change in incentive structure (focus on both branded and private label); and (3) margins to remain steady with increase in private label share, which may be offset by new store additions. We see a pick-up in sales growth, led by a balanced approach to mature store growth, new store additions, and private label expansion. Moreover, margins are expected to see gradual improvement, led by a better mix, steady growth in matured stores (2+ years; ~10–11% margin), increased private label share, and supply chain efficiencies. Factoring in Q3, we have raised EBITDA for FY26/27E by 3% and revised TP to INR 1,060 (17x Q3FY28E EV/EBITDA, implying 26x pre-INDAS EV/EBITDA). BUY stays.
Medplus Health Services Q3 Highlights
Sales grew 16% YoY to INR 18.06bn, with 16% growth in retail pharmacy (~INR 17.71 bn) and 19% growth in diagnostics (INR 327mn). GM improved to 26.2% (+113 bps YoY), which was offset by higher costs (staff/ SG&A +19/18%) led to EBITDA^ of INR 1.65 bn (+25% YoY). Operating profit was INR 968mn (+21% YoY) and OPM at 5.4% (+24 bps). Pharmacy margin was 5.2% (+13 bps), diagnostic margin 15.5%, and PAT INR 648mn (+41%).
Medplus Health Services Q3 Operating Metrics
A net 182 stores were added (gross addition of 228), taking the total to 5,112, as of Dec’25. Mature store growth was at 10.5% YoY (vs. 4.4% in Q3FY25), with operating margin at 12.4% (vs. 11%) and RoCE at 77.7% (vs. 61.7%). Private label sales as a percentage of total sales rose to 22.2% (vs. 19.6% in Q3FY25). Overall RoCE was ~24.2% (up from 18.7%). In Q3FY26, OCF stood at INR 905mn while FCF was negative at INR 93mn.
Key takeaways from con call
Gross margin break-up: Private label pharma at 65-70%, private label non-pharma 25-30%, branded pharma at 13-14%, and branded non-pharma at 13-14%. Private label GMV share was at ~18.9% (net at 11.6%). As of Dec-25, diagnostics had 180k active plans, covering 368k lives; with a renewal rate of 23%. It has operationalized 60-70% of planned warehouses and manpower recruitment completed; balance warehouses to be commissioned soon; the company does not see a major increase in costs.
Quarterly Financial Summary
Source: HSIE Research (HSIE Results Daily – 03 Feb 26 – HSIE-202602030656002630379.pdf)
Disclaimer:
This report has been prepared by HDFC Securities Ltd and is solely for information of the recipient only. The report must not be used as a singular basis of any investment decision. The views herein are of a general nature and do not consider the risk appetite or the particular circumstances of an individual investor; readers are requested to take professional advice before investing. This report may have been refined using AI tools to enhance clarity and readability.
Nothing in this document should be construed as investment advice. Each recipient of this document should make such investigations as they deem necessary to arrive at an independent evaluation of an investment in securities of the companies referred in this document (including merits and risks) and should consult their own advisors to determine merits and risks of such investment. The information and opinions contained herein have been compiled or arrived at, based upon information obtained in good faith from sources believed to be reliable. Such information has not been independently verified and no guarantee, representation or warranty, express or implied, is made as to its accuracy, completeness or correctness. All such information and opinions are subject to change without notice. Descriptions of any company or companies or their securities mentioned herein are not intended to be complete. HSL is not obligated to update this report for such changes. HSL has the right to make changes and modifications at any time.
This report is not directed to, or intended for display, downloading, printing, reproduction or for distribution to use by, any person or entity who is a citizen or resident or located in any locality, state, country or other jurisdiction where such distribution, publication, reproduction, availability or use would be contrary to law or regulation or what would subject HSL or its affiliates to any registration or licensing requirement within such jurisdiction.
If this report is inadvertently or has reached any person in such country, especially, United States of America, the same should be ignored and brought to the attention of the sender. This document may not be reproduced, distributed or published in whole or in part, directly or indirectly, for any purposes or in any manner.
Foreign currencies denominated securities, where mentioned, are subject to exchange rate fluctuations, which could have an adverse effect on their value or price, or the income derived from them. In addition, investors in securities such as ADRs, the values of which are influenced by foreign currencies effectively assume currency risk. It should not be considered to be taken as an offer to sell or a solicitation to buy any security.
This document is not, and should not, be construed as an offer or solicitation of an offer, to buy or sell any securities or other financial instruments. This report should not be construed as an invitation or solicitation to do business with HSL. HSL may from time to time solicit from, or perform brokerage, or other services for, any company mentioned in this mail and/or its attachments.
HSL and its affiliated company(ies), their directors and employees may: (a) from time to time, have a long or short position in, and buy or sell the securities of the company(ies) mentioned herein or (b) be engaged in any other transaction involving such securities and earn brokerage or other compensation or act as a market maker in the financial instruments of the company(ies) discussed herein or act as an advisor or lender/borrower to such company(ies) or may have any other potential conflict of interests with respect to any recommendation and other related information and opinions.
HSL, its directors, analysts or employees do not take any responsibility, financial or otherwise, for the losses or the damages sustained due to the investments made or any action taken on basis of this report, including but not restricted to, fluctuation in the prices of shares and bonds, changes in the currency rates, diminution in the NAVs, reduction in the dividends or income etc.
HSL and other group companies, its directors, associates, employees may have various positions in any of the stocks, securities and financial instruments dealt in the report, or may make sell or purchase or other deals in these securities from time to time or may deal in other securities of the companies / organizations described in this report. As regards the associates of HSL please refer the website.
HSL or its associates might have managed or co-managed public offering of securities for the subject company or might have been mandated by the subject company for any other assignment in the past twelve months.
HSL or its associates might have received any compensation from the companies mentioned in the report during the preceding twelve months from the date of this report for services in respect of managing or co-managing public offerings, corporate finance, investment banking or merchant banking, brokerage services or other advisory service or a merger or specific transaction in the normal course of business.
HSL or its analysts did not receive any compensation or other benefits from the companies mentioned in the report or third party in connection with preparation of the research report. Accordingly, neither HSL nor Research Analysts have any material conflict of interest at the time of publication of this report. Compensation of our Research Analysts is not based on any specific merchant banking, investment banking or brokerage service transactions. HSL may have issued other reports that are inconsistent and reach different conclusion from the information presented in this report.
Research entity has not been engaged in market making activity for the subject company. Research analyst has not served as an officer, director or employee of the subject company. We have not received any compensation/benefits from the subject company or third party in connection with the Research Report.
Please note that HDFC Securities has a proprietary trading desk. This desk maintains an arm’s length distance with the Research team and all its activities are segregated from Research activities. The proprietary desk operates independently, potentially leading to investment decisions that may deviate from research views.
HDFC Securities Limited, I Think Techno Campus, Building – b, “Alpha”, Office Floor 8, Near Kanjurmarg Station, Opp. Crompton Greaves, Kanjurmarg (East), Mumbai 400 042 Phone: (022) 3075 3400 Fax: (022) 2496 5066
Compliance Officer: Mr Milan V Karker Email: complianceofficer@hdfcsec.com Phone: (022) 3045 3600
For grievance redressal contact Customer Care Team Email: customercare@hdfcsec.com Phone: (022) 3901 9400
HDFC Securities Limited. SEBI Reg. No.: INESE, BSE, MSEI, MCX: INZ000186537; AMFI Reg. No. ARN: 13549; PFRDA Reg. No. POP: 11092018; IRDA Corporate Agent License No.: CA0062; SEBI Research Analyst Reg. No.: INH000002475; SEBI Investment Adviser Reg. No.: INA000011538; CIN – U67120MH2000PLC152193 Investment in securities market are subject to market risks. Read all the related documents carefully before investing.
Mutual Funds Investments are subject to market risks. Please read the offer and scheme related documents carefully before investing.
Registration granted by SEBI, membership of BASL (in case of IAs) and certification from NISM in no way guarantee performance of the intermediary or provide any assurance of returns to investors.